Historical research note: Odaily published its translation of this analysis on November 11, 2026, at 14:00 UTC+8. The underlying research is attributed to 0d Labs CEO matteo. Its observations describe the periods specified below, not current market conditions.
Hyperliquid’s ability to support deep order books for long-tail assets has been part of its appeal to traders. An analysis by 0d Labs CEO matteo finds that, in the markets studied, liquidity close to the mid-price deteriorated over the preceding year—even where orders remained farther from the market. The evidence establishes a change in the sampled order books, but not a single cause.
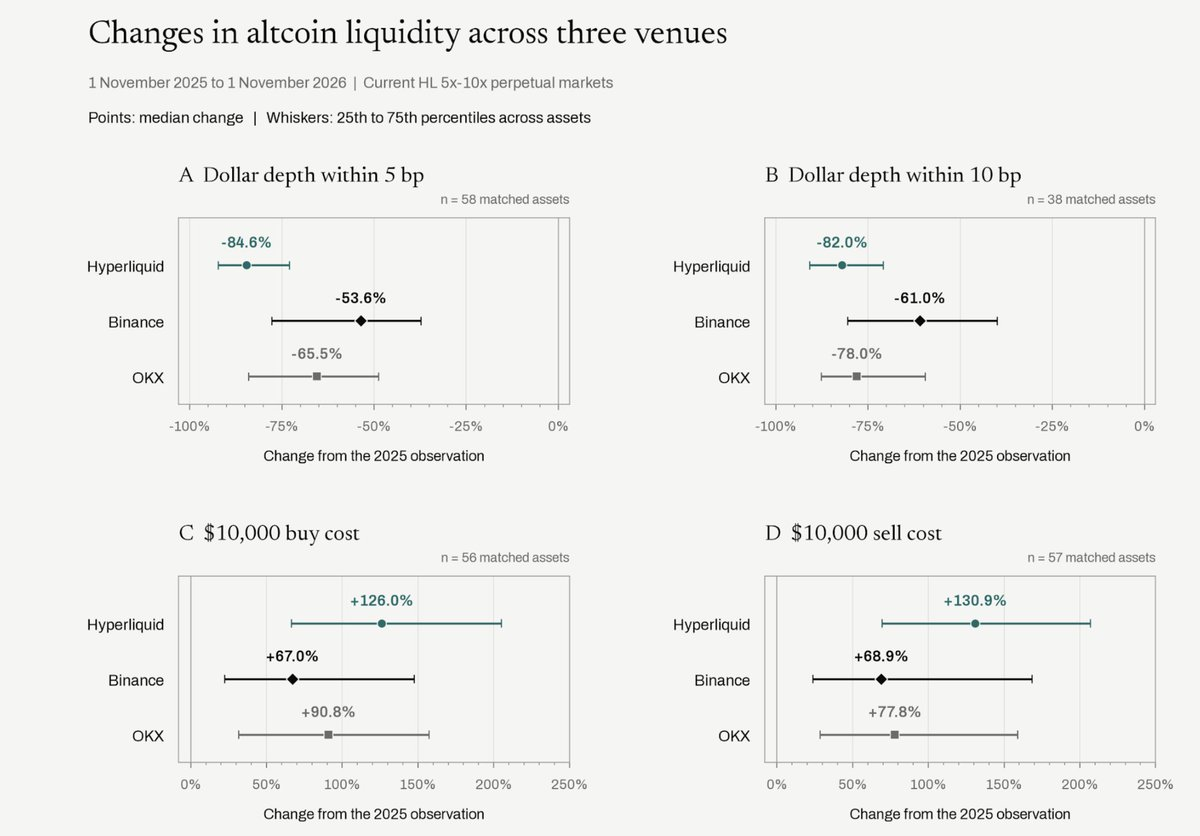
Comparing like-for-like markets
The author used order-book records accumulated over more than a year and a half and selected 86 assets traded on both Hyperliquid and Binance with maximum leverage below 10× for a comparison spanning November 1, 2025, to November 1, 2026. Binance served as a benchmark for broader altcoin liquidity conditions.
Across 38 markets comparable within 10 basis points (bps) of the mid-price, median dollar-denominated depth fell 82% on Hyperliquid, 61% on Binance and 78% on OKX. To compare the same asset across venues, the author also calculated each market’s Hyperliquid-to-Binance depth ratio. Within 5 bps, the median change in that market-by-market ratio was a decline of 57.5%; it was not calculated by dividing the venues’ aggregate median depths.
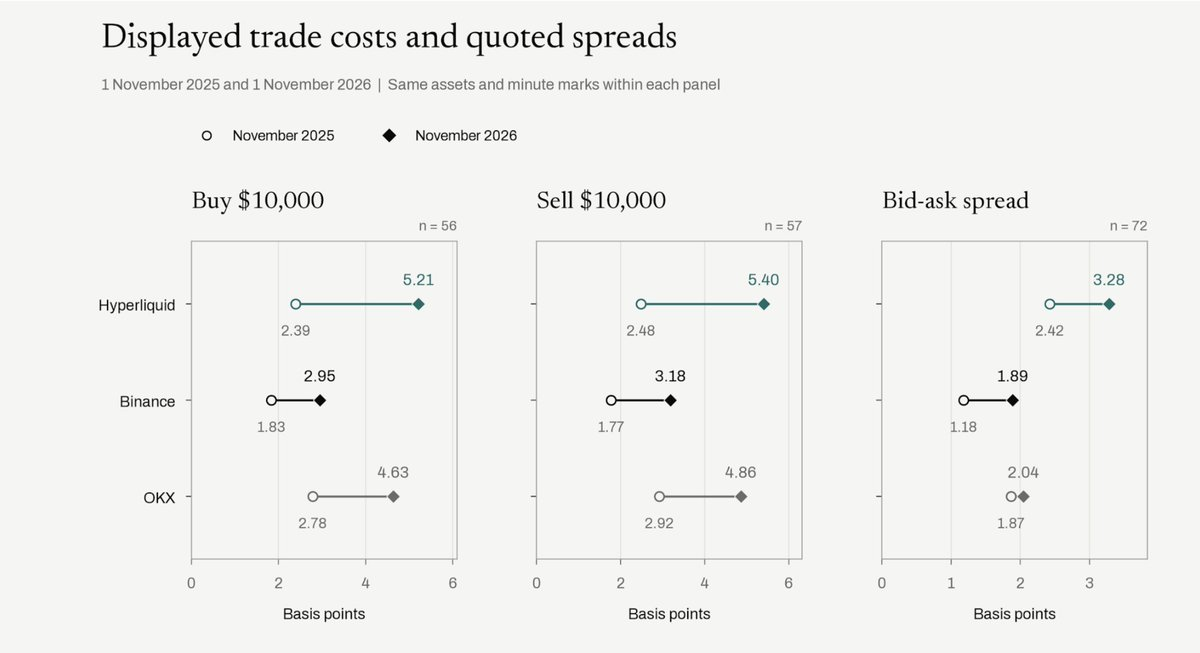
For a hypothetical $10,000 buy in the later sample period, displayed orders implied a median execution cost of 5.21 bps, or $5.21, on Hyperliquid versus 2.95 bps, or $2.95, on Binance, before fees. Spread offers a qualification: Binance’s spread widened more in relative terms, although it started narrower and remained narrower.
The distinction between nearby and distant orders
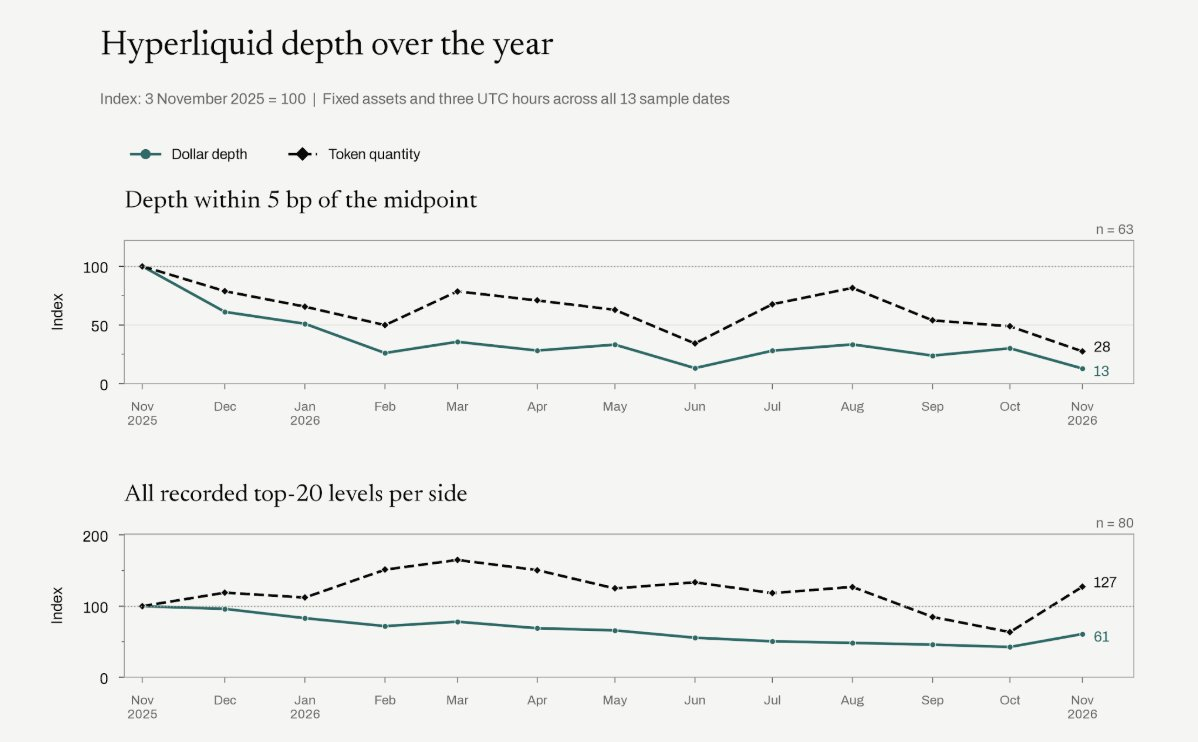
A falling token price can reduce dollar-denominated depth without removing token-denominated orders. To examine that possibility, the author tracked both measures across 13 sampling dates, holding each comparison’s asset set and observation period fixed. These stricter samples covered 63 markets within 5 bps and 80 markets in the broader 20-bps analysis; their endpoints should not be substituted for the cross-venue comparison above.
With each market indexed to 100 in November 2025, the median Hyperliquid market’s 5-bps dollar-depth index fell to about 13 a year later, while its token-quantity index fell to about 28. Across all 20 recorded order-book levels, the corresponding endpoints were 61 and 127. In other words, the typical sampled market held more token units across those recorded levels, but substantially fewer immediately around the mid-price. The author notes that overall depth improved during the final six months, chiefly farther from the market price.
Did participation become more concentrated?
The author grouped main accounts with their clearly linked subaccounts, rather than counting them as separate participants. For the same 80 markets, a comparison of one complete week a year earlier with a recent complete week found that the largest account group’s median share of market-maker trading volume fell from 25.2% to 14.6%. That result does not support attributing the year-long liquidity decline simply to one firm taking over trading volume.
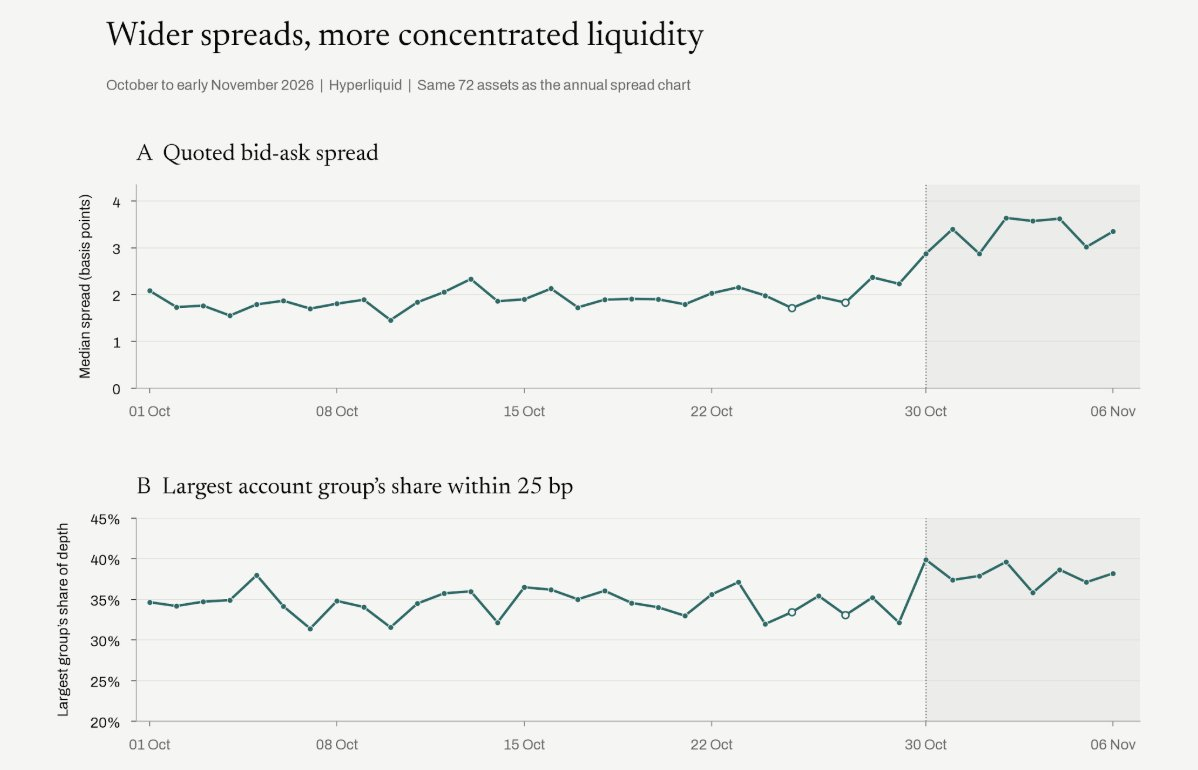
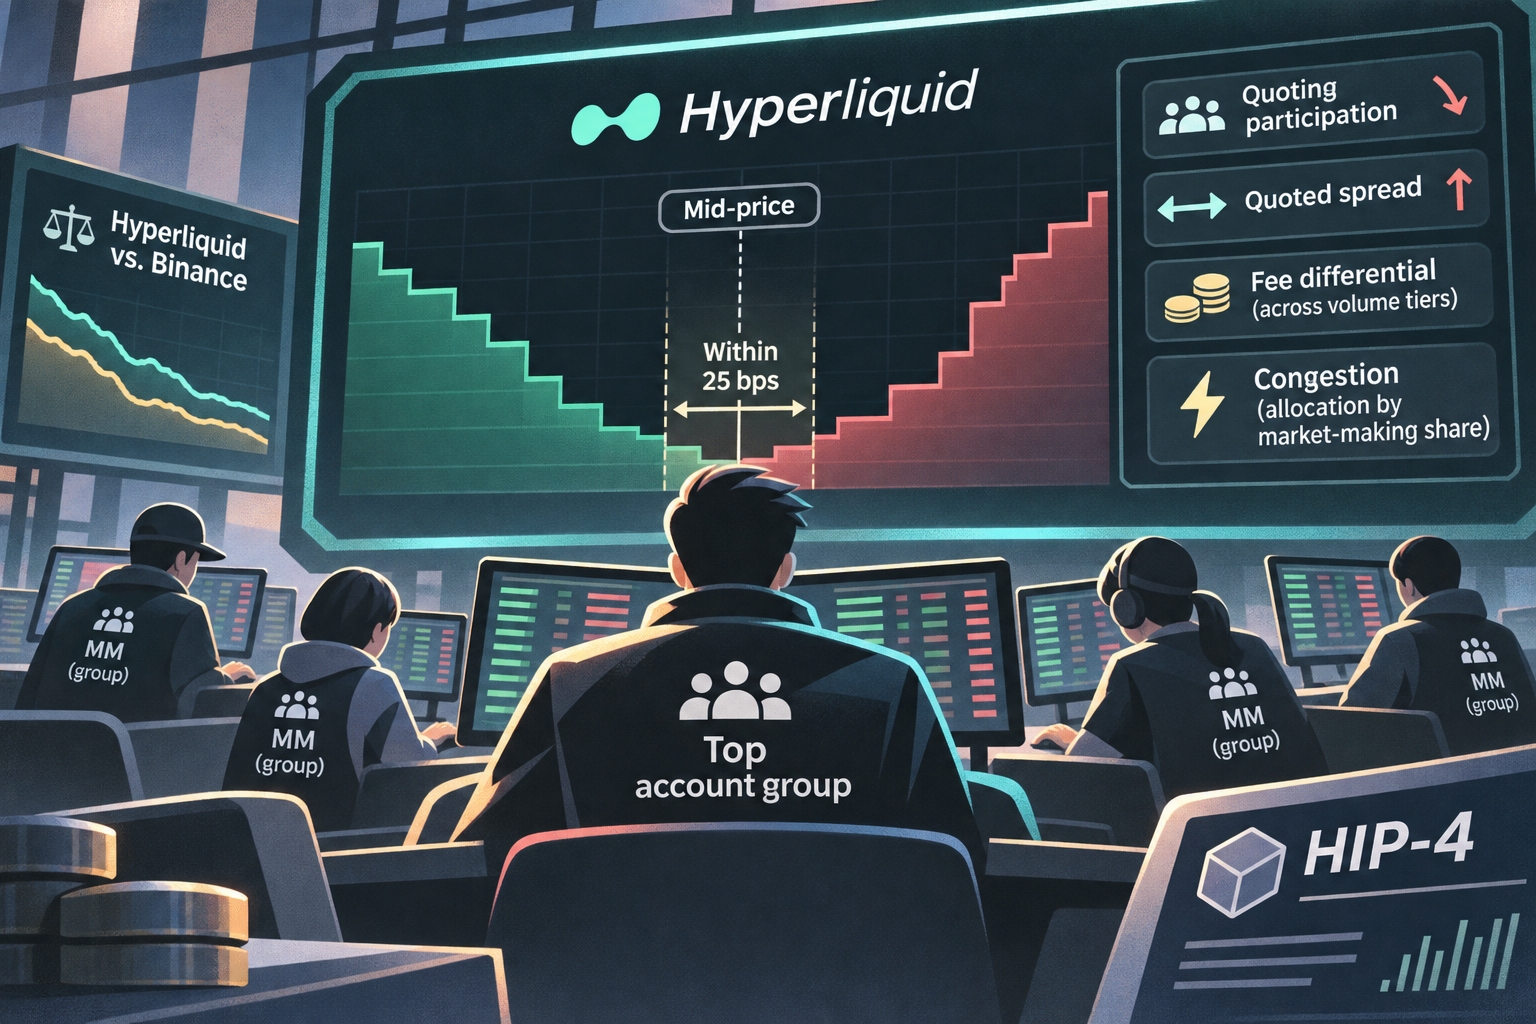
A shorter window showed a different change on the quoting side. Across 72 assets, comparing October 8–14 with October 31–November 6, 2026, the largest account group’s median share of quotes within 25 bps rose from 34.5% to 38.6%, while the median quoted spread widened from 2.13 to 3.55 bps. The average number of account groups posting at least $1,000 on each side within that range fell from 7.64 to 6.39. The author reports a decline in 58 of the 72 markets even when holding token prices constant.
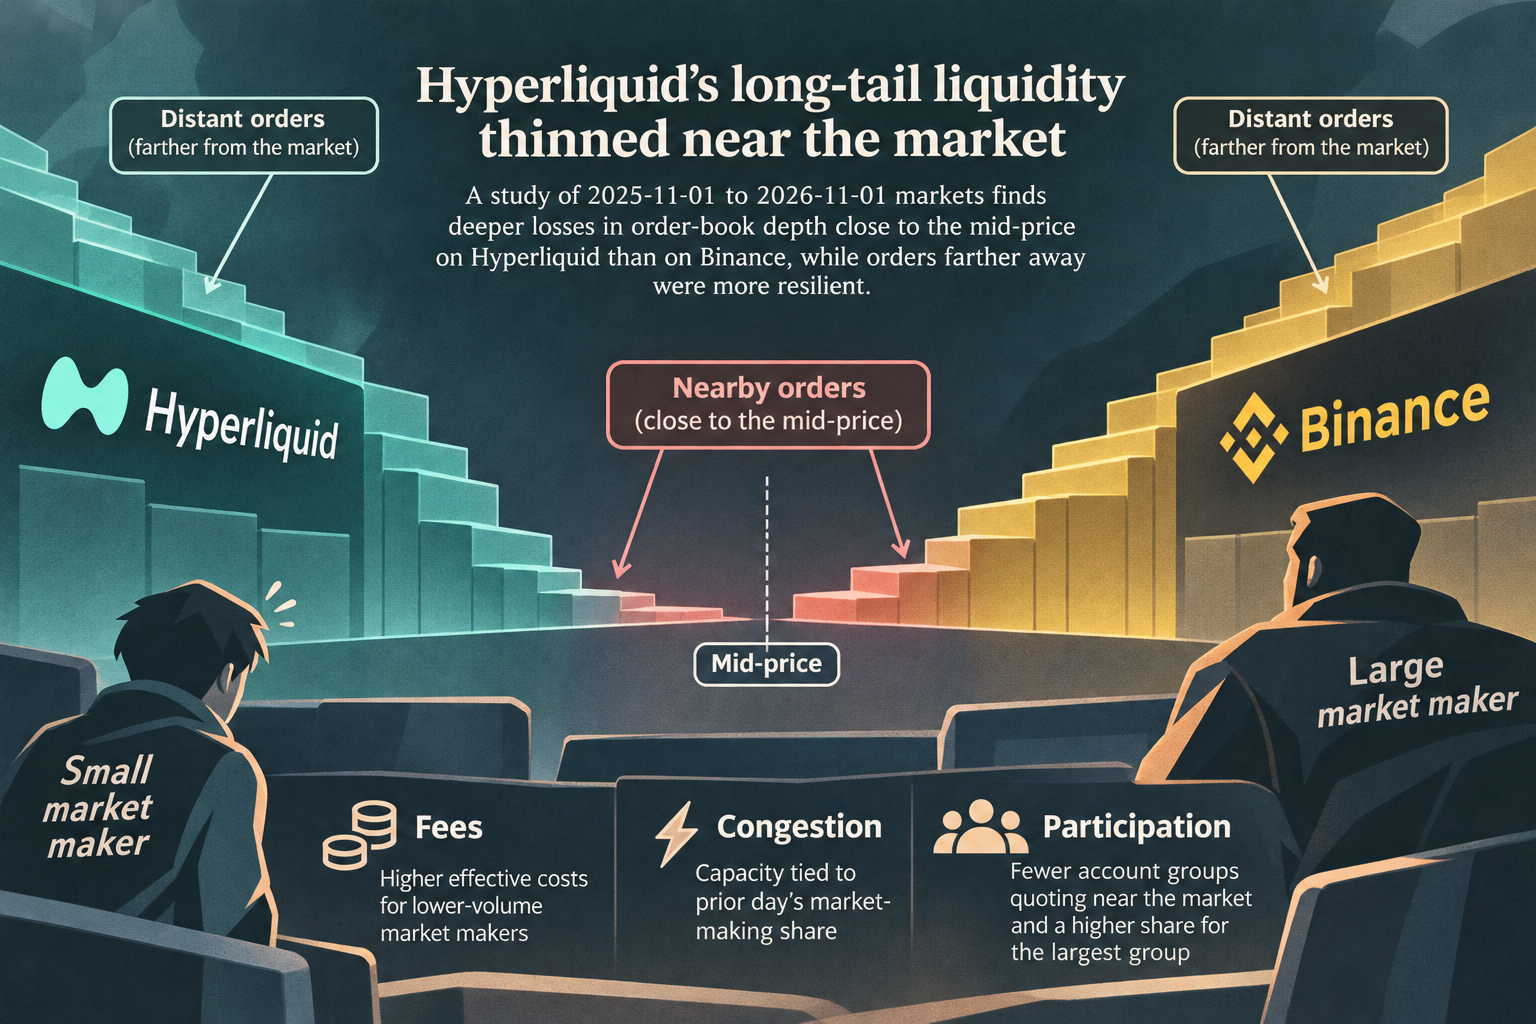
These movements do not identify their cause. The author cites traders’ complaints about priority fees and congestion, but also notes a Binance security event on October 29 during the observation window and a large liquidity provider’s sharp reduction in quotes around November 3. The available comparisons cannot isolate the effects of those events or establish that platform mechanisms caused the spread change.
Costs and the HIP-4 question
For 54 account groups, the author calculated historical market-maker fees using volume-weighted rates. The lowest-volume quartile paid an average of 0.961 bps; the highest-volume quartile received an average rebate of 0.236 bps. That is a fee differential of roughly 1.20 bps before hedging costs or adverse fills—potentially consequential when spreads are only a few basis points wide.
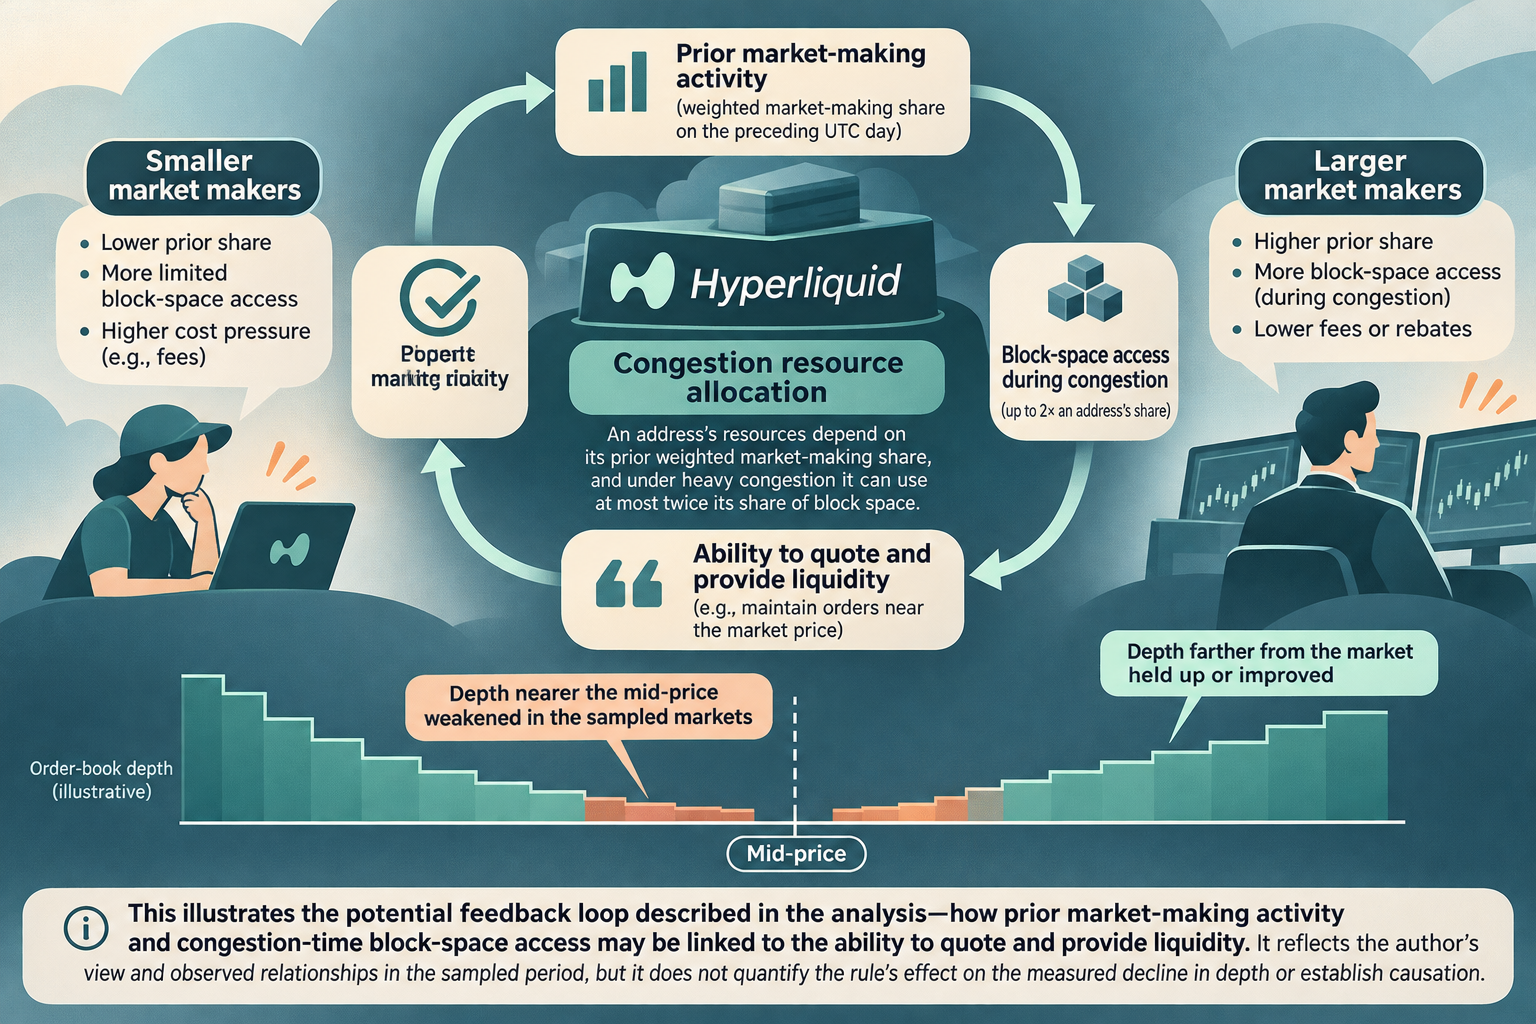
The article also describes Hyperliquid’s congestion allocation rule: an address’s resources depend on its weighted market-making share on the preceding UTC day, and under heavy congestion it can use at most twice its share of block space. The author argues that this may make it harder for smaller market makers to build the volume needed to obtain capacity, but the analysis does not quantify that rule’s effect on the measured decline in depth.
In a separate November 10 sample of 256 HIP-4 contracts, four professional market-making wallets supplied 47% of visible depth within 25 bps of the mid-price, according to the author. Those markets were still small. The finding illustrates why reliable participation by smaller quoting firms matters to the author’s proposed long-tail prediction-market ecosystem; it does not establish how HIP-4 liquidity will develop.
The research therefore supports a narrower conclusion than a definitive explanation: in the sampled period, Hyperliquid lost nearby long-tail order-book depth relative to Binance, and recent quoting participation weakened. Whether fee design, congestion, individual providers’ decisions or wider market conditions drove each change remains unresolved.