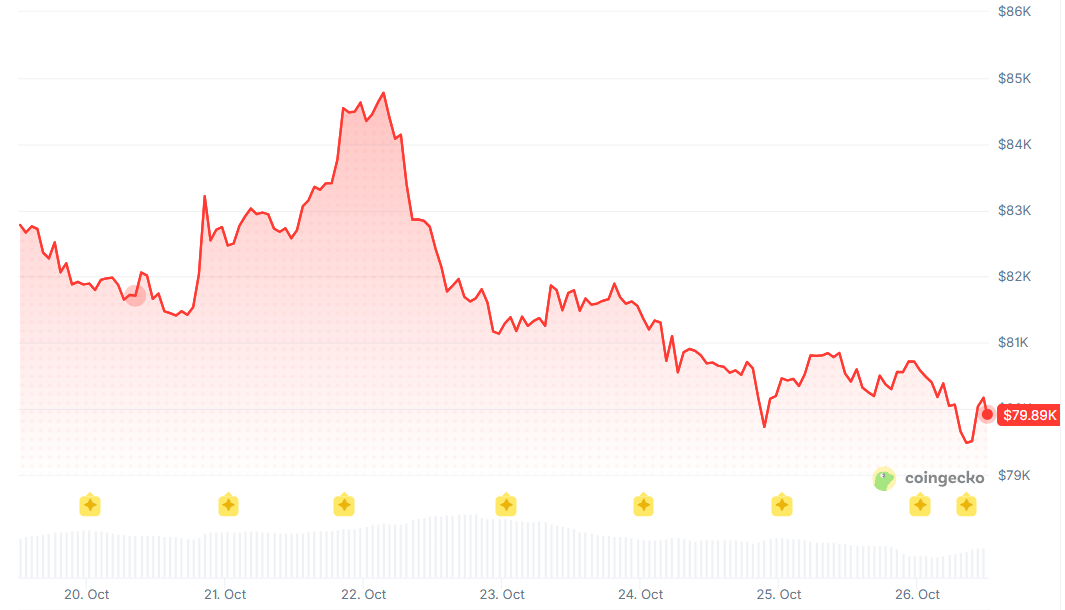
As reported on October 27, 2026, Bitcoin had briefly fallen below $80,000 over the weekend, reaching $79,280 before a modest rebound. The source frames the move as a test of leveraged positions and expectations for monetary policy—not evidence that one factor alone caused the decline. Its figures and technical levels describe that reporting period, not current market conditions.
What the fund flows show—and what they do not
The report puts weekly net outflows from US spot Bitcoin ETFs at $442.6 million, despite citing a larger, $635.5 million net outflow on October 22. Those figures can coexist if other days had offsetting inflows. Against more than $57 billion in cumulative net inflows since launch and reported assets of roughly $104 billion–$105 billion, the weekly figure alone does not establish a sustained institutional exit.
The report also cites $224.96 million in weekly outflows from Ether funds against $14.5 billion in assets. It interprets that proportionally larger withdrawal as a sign of weaker institutional appetite for ETH, but fund flows cannot, by themselves, establish investors’ motives. The article links the October 22 withdrawals to a broader sell-off amid concerns about AI financing; that causal explanation remains its interpretation.

Where leverage and exchange flows matter
Bitfinex analysts had identified $79,821 as a level that could trigger forced liquidations, according to the report. Bitcoin’s subsequent $79,280 low crossed that threshold, while the report cites nearly $400 million in long liquidations across Bitcoin and Ether within four hours. Crossing a forecast level does not, on its own, prove that it caused those liquidations.
The source attributes another potential warning signal to KuCoin data: retail BTC net deposits to major trading platforms reportedly rose from $5.5 billion to $10.75 billion over the preceding month, while inflows attributed to whales fell from $5.9 billion in late August to $3.8 billion. Exchange deposits may indicate an intention to sell, but they are not sales. Without the dataset’s measurement definitions or a breakdown of subsequent transactions, the competing accumulation and distribution interpretations cannot be resolved.
The report further says Bitcoin traded at a discount on Coinbase relative to “BN” during the month, with the seven-day average premium at its lowest since August. It presents this as evidence of weaker US buying interest; the supplied text does not define the comparison venue or quantify the discount.
A macro thesis, not a settled forecast
The report argues that uncertainty over the Federal Reserve’s next decision made Bitcoin harder to price against interest-rate expectations. It attributes a refusal to prejudge the October 27–28 meeting to Kevin Warsh at an October 16 IMF meeting and describes a pause as the market’s prevailing expectation as of October 24. These are claims and expectations in the supplied report, not independently established outcomes of that meeting.

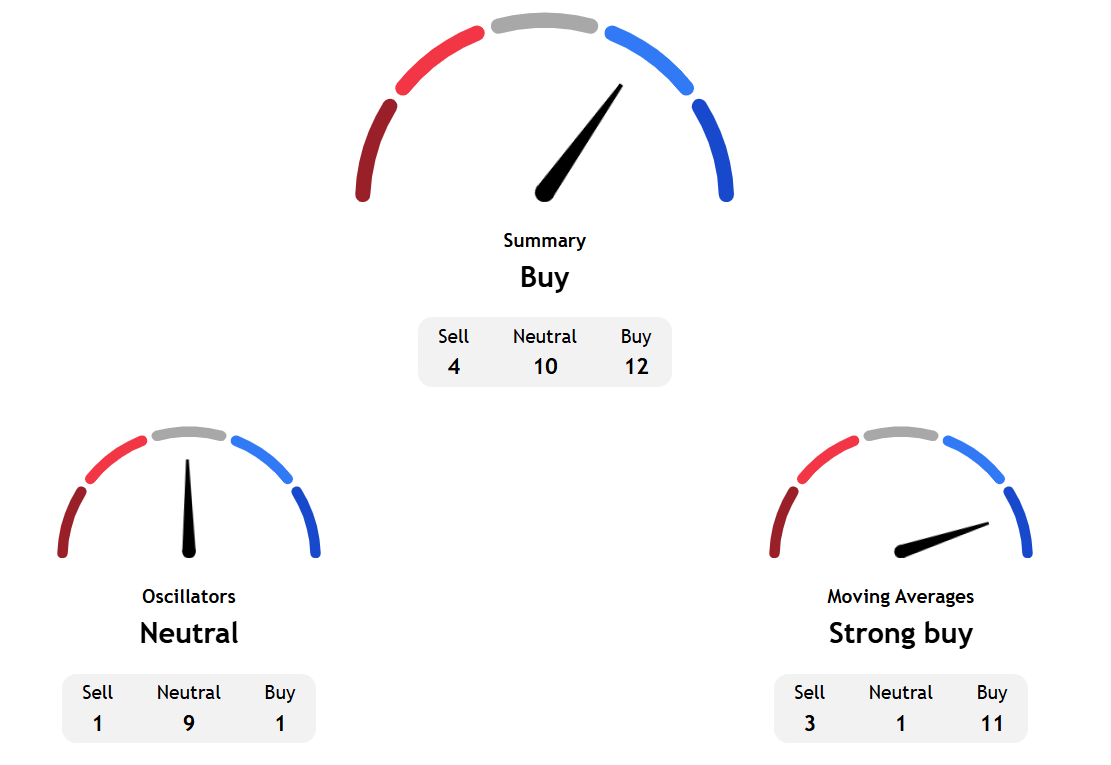
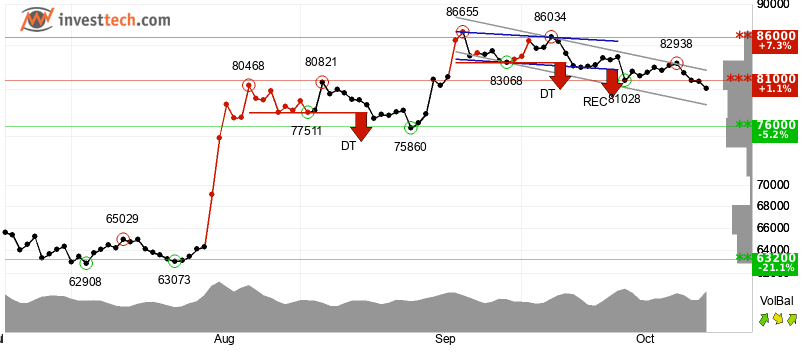
Its technical readings also conflict. TradingView’s composite assessment was described as a “buy,” while InvestTech’s one-to-six-week model was negative and identified $81,000 as potential resistance after a break below it. The source cites $79,578 as a possible daily-close threshold for further weakness and $72,941 for the 200-day simple moving average. These are dated model readings and conditional levels, not guaranteed support or price targets.
The defensible conclusion is narrower than the report’s directional forecasts: as of its October 27 reporting, Bitcoin had crossed a closely watched leverage level while ETF flows and macro expectations remained mixed. The supplied evidence does not isolate a single cause for the move or establish what happened after the pending policy decisions.