Reporting context: November 18, 2026. The figures below describe the market conditions in Glassnode’s report at that time, not current readings.
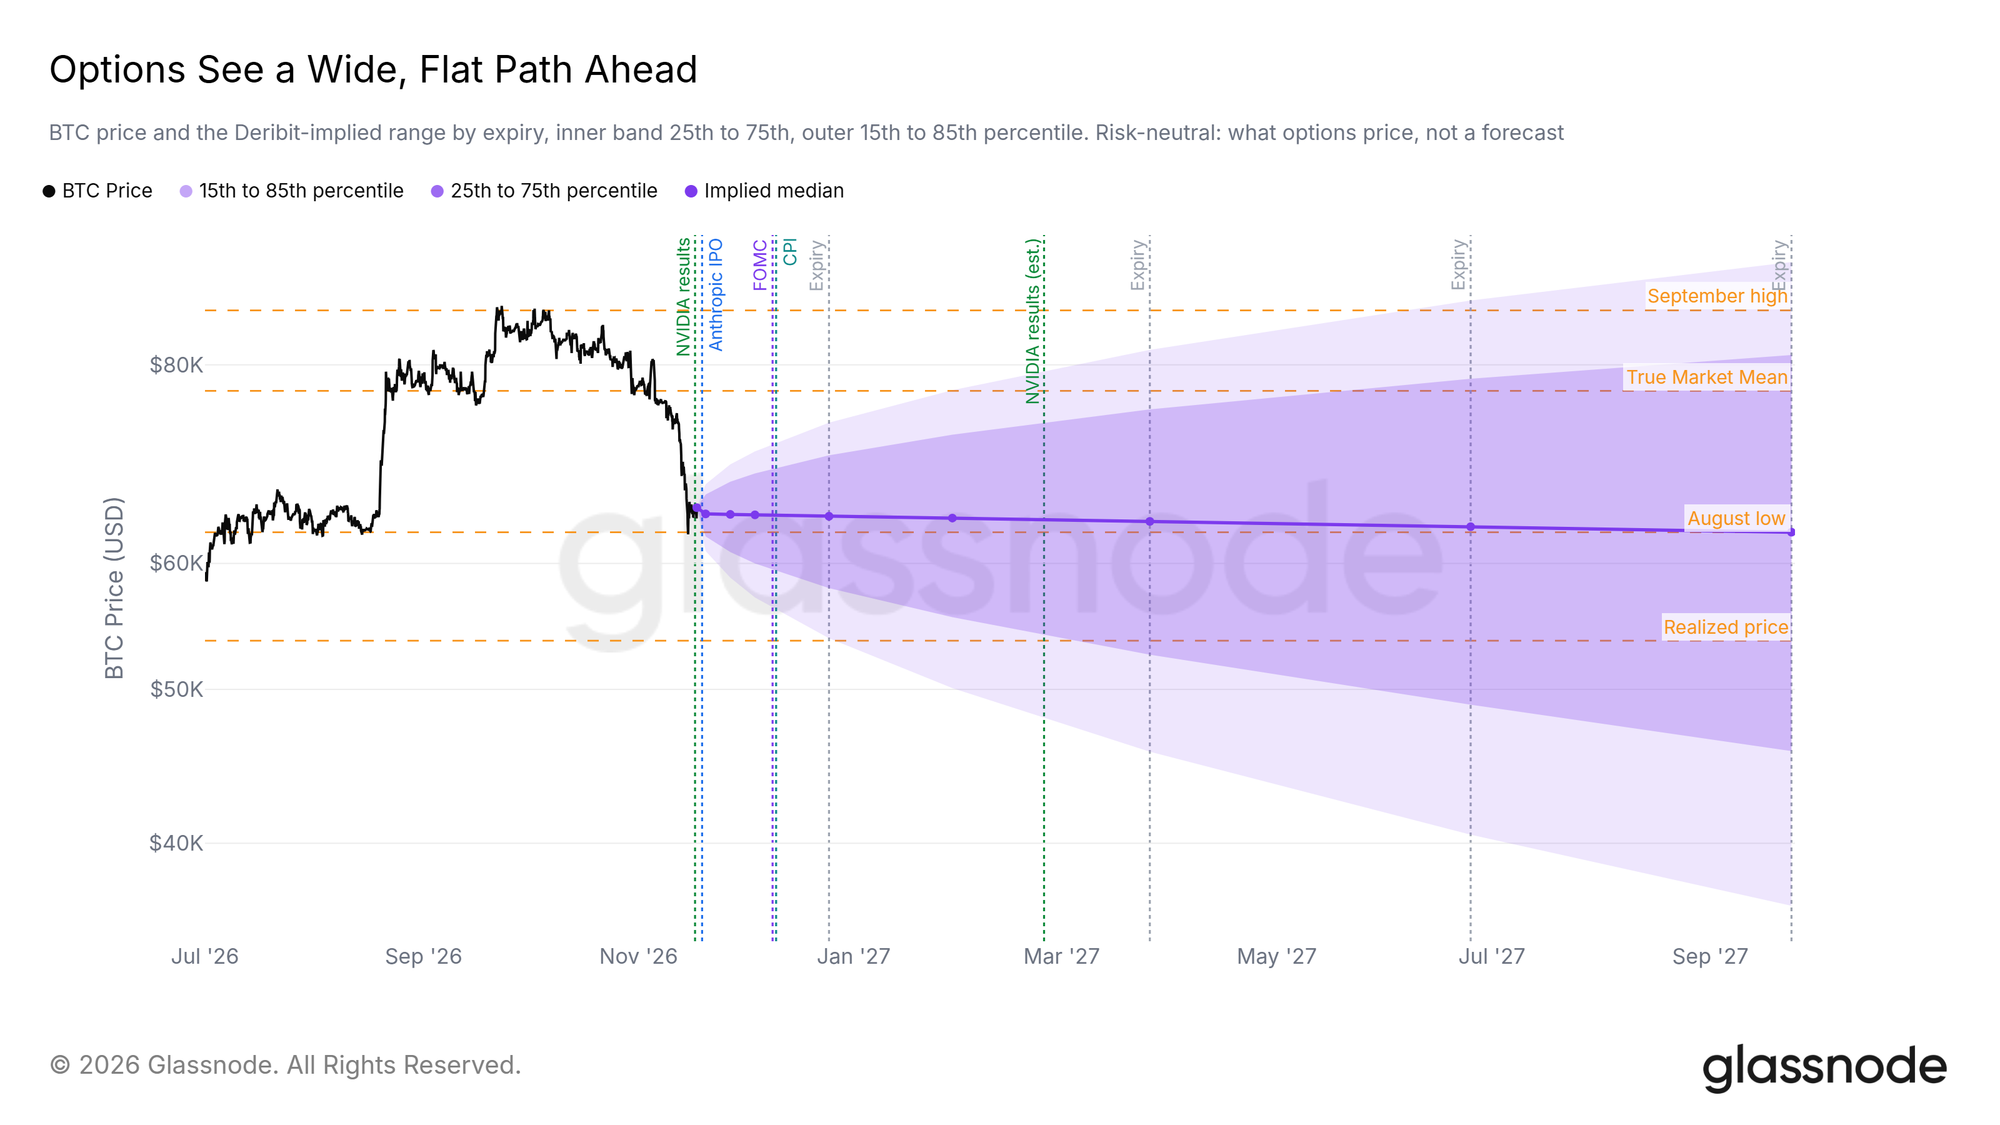
Bitcoin fell to about $62,000 on November 15, 2026. Glassnode’s account of the decline points to two simultaneous pressures: investors selling coins at a loss and leveraged long positions being forced out. The central question is whether buyers around $62,000–$66,000 could absorb that selling. The reported order-book data showed bids, but did not establish that the price zone would hold.
Who sold at a loss?
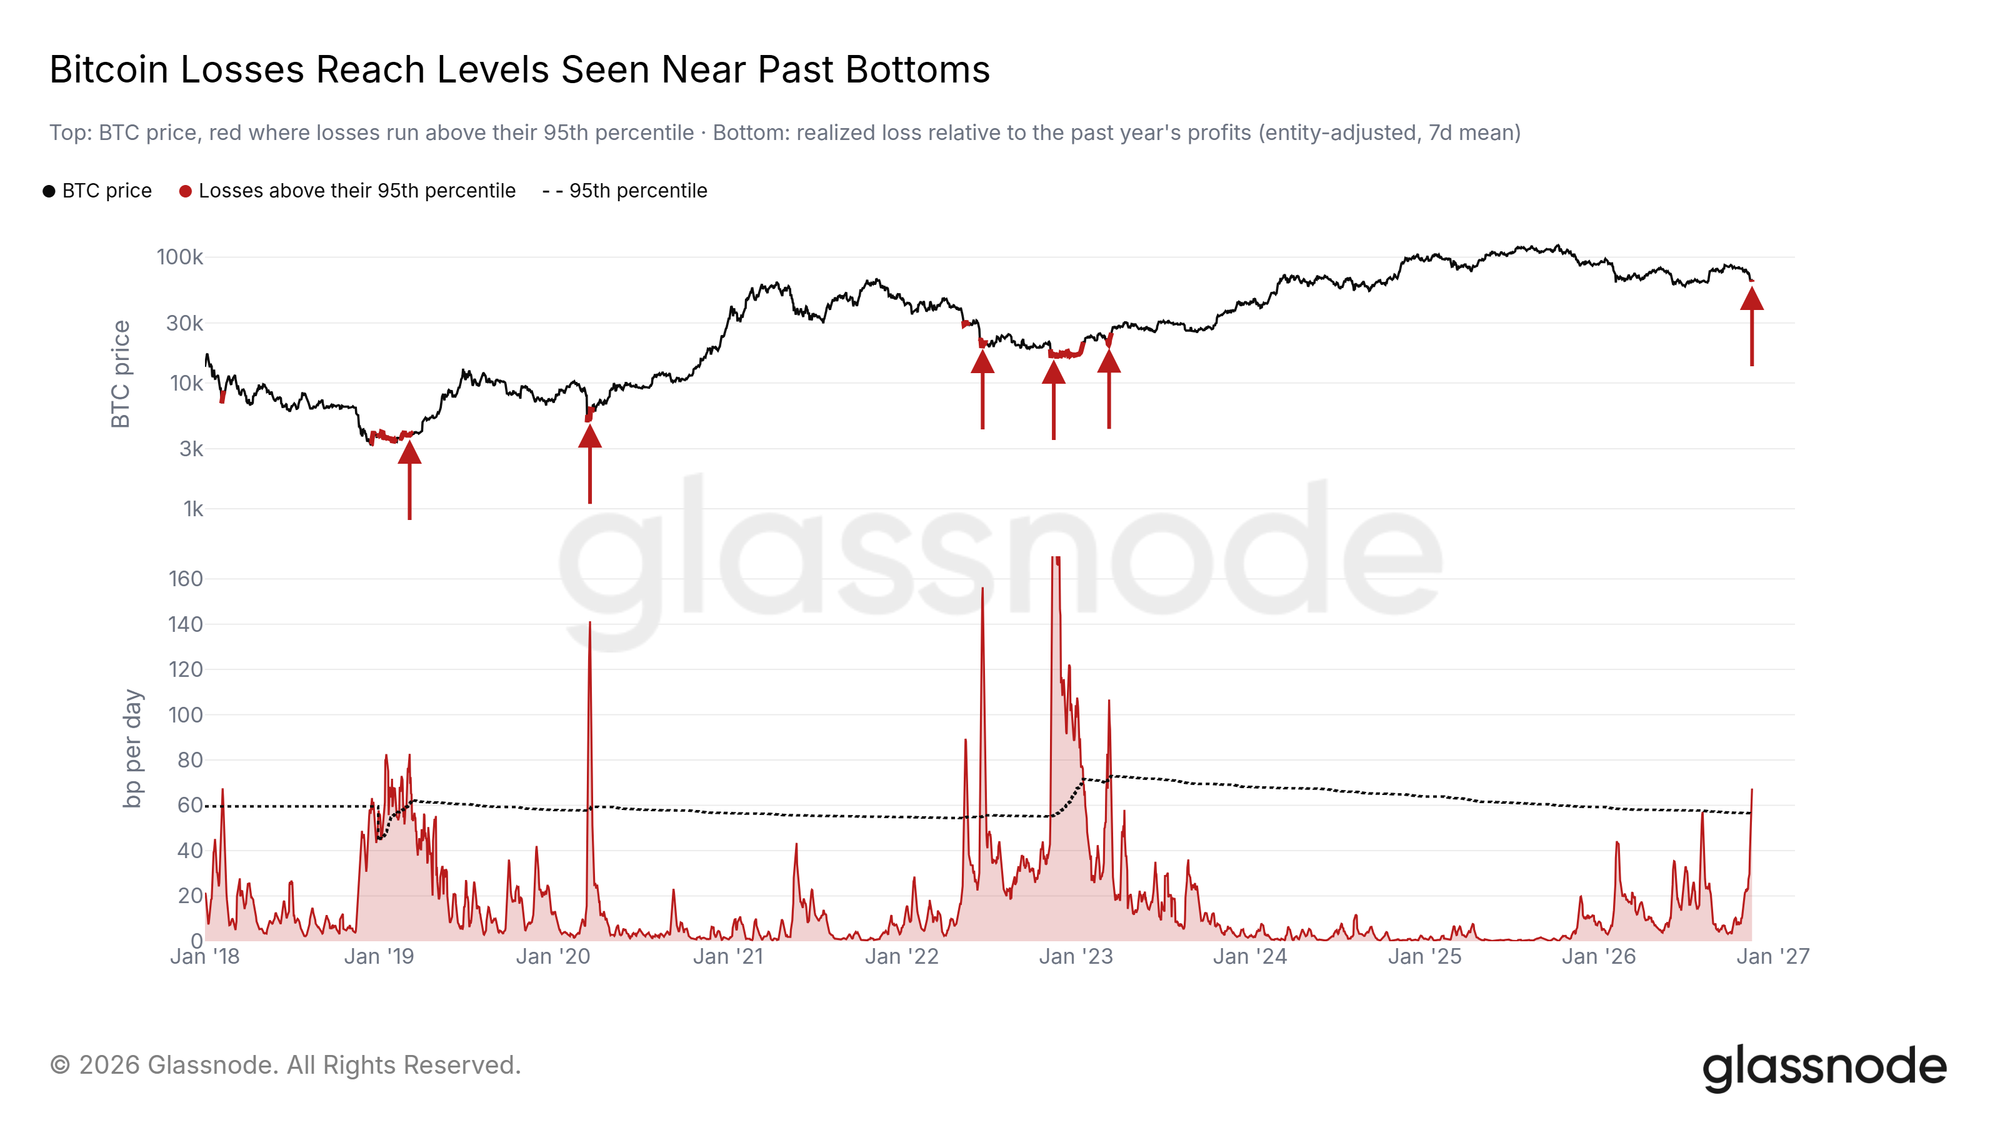
Glassnode measured realized losses relative to Bitcoin’s realized capitalization to compare the sell-off with earlier cycles. It said the normalized measure reached a level previously seen around severe market lows in 2018, 2020, 2022 and early 2023—the first reading of that severity in the cycle covered by its report.
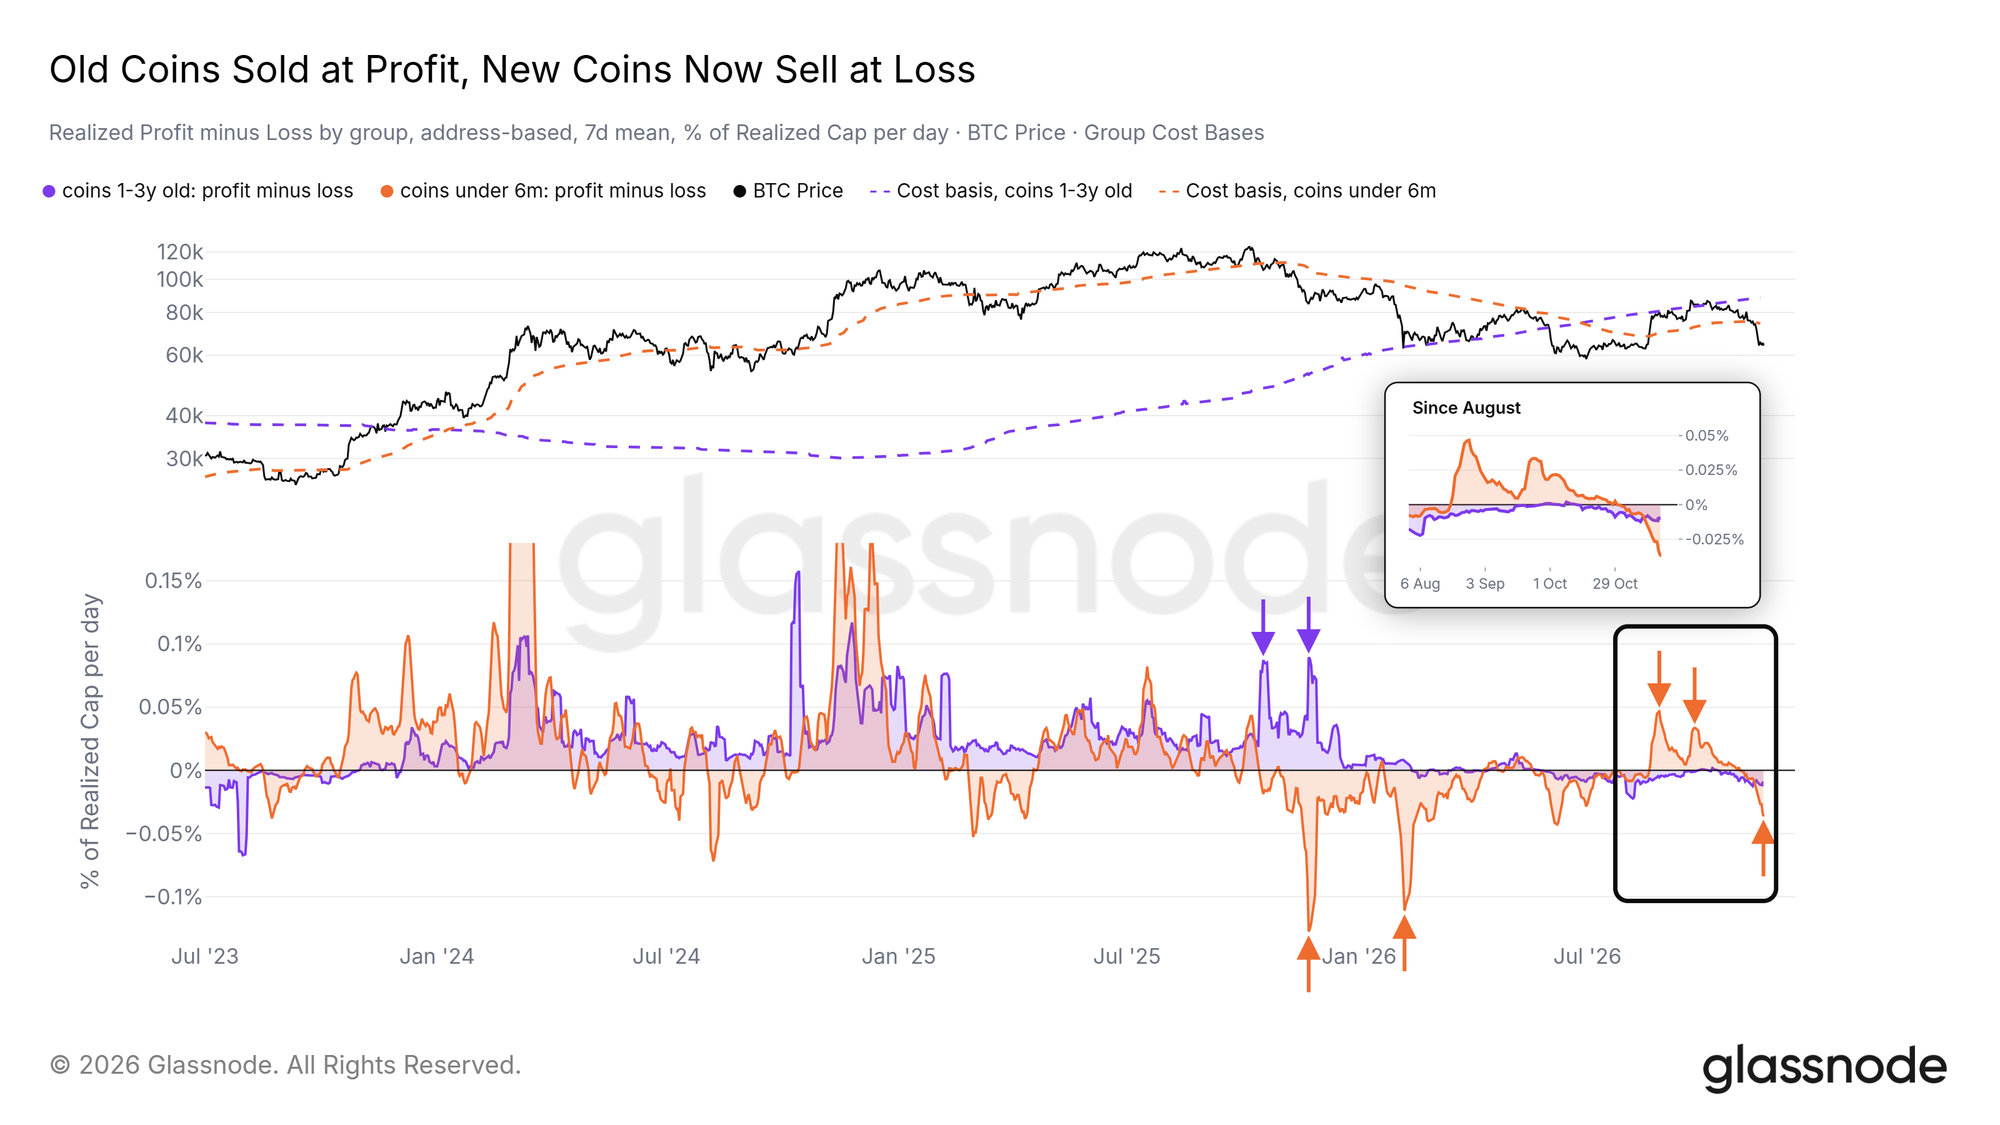
Glassnode attributed most of the recent selling to investors who had bought within the preceding 12 months, particularly holders of less than three months. It said coins held for one to three years had largely remained inactive after that group took substantial profits by late 2025. At the time of reporting, Bitcoin traded below the average purchase prices of both recent-buyer groups, leaving them exposed to further realized losses if they sold.
The cost-basis zone and the bids beneath it
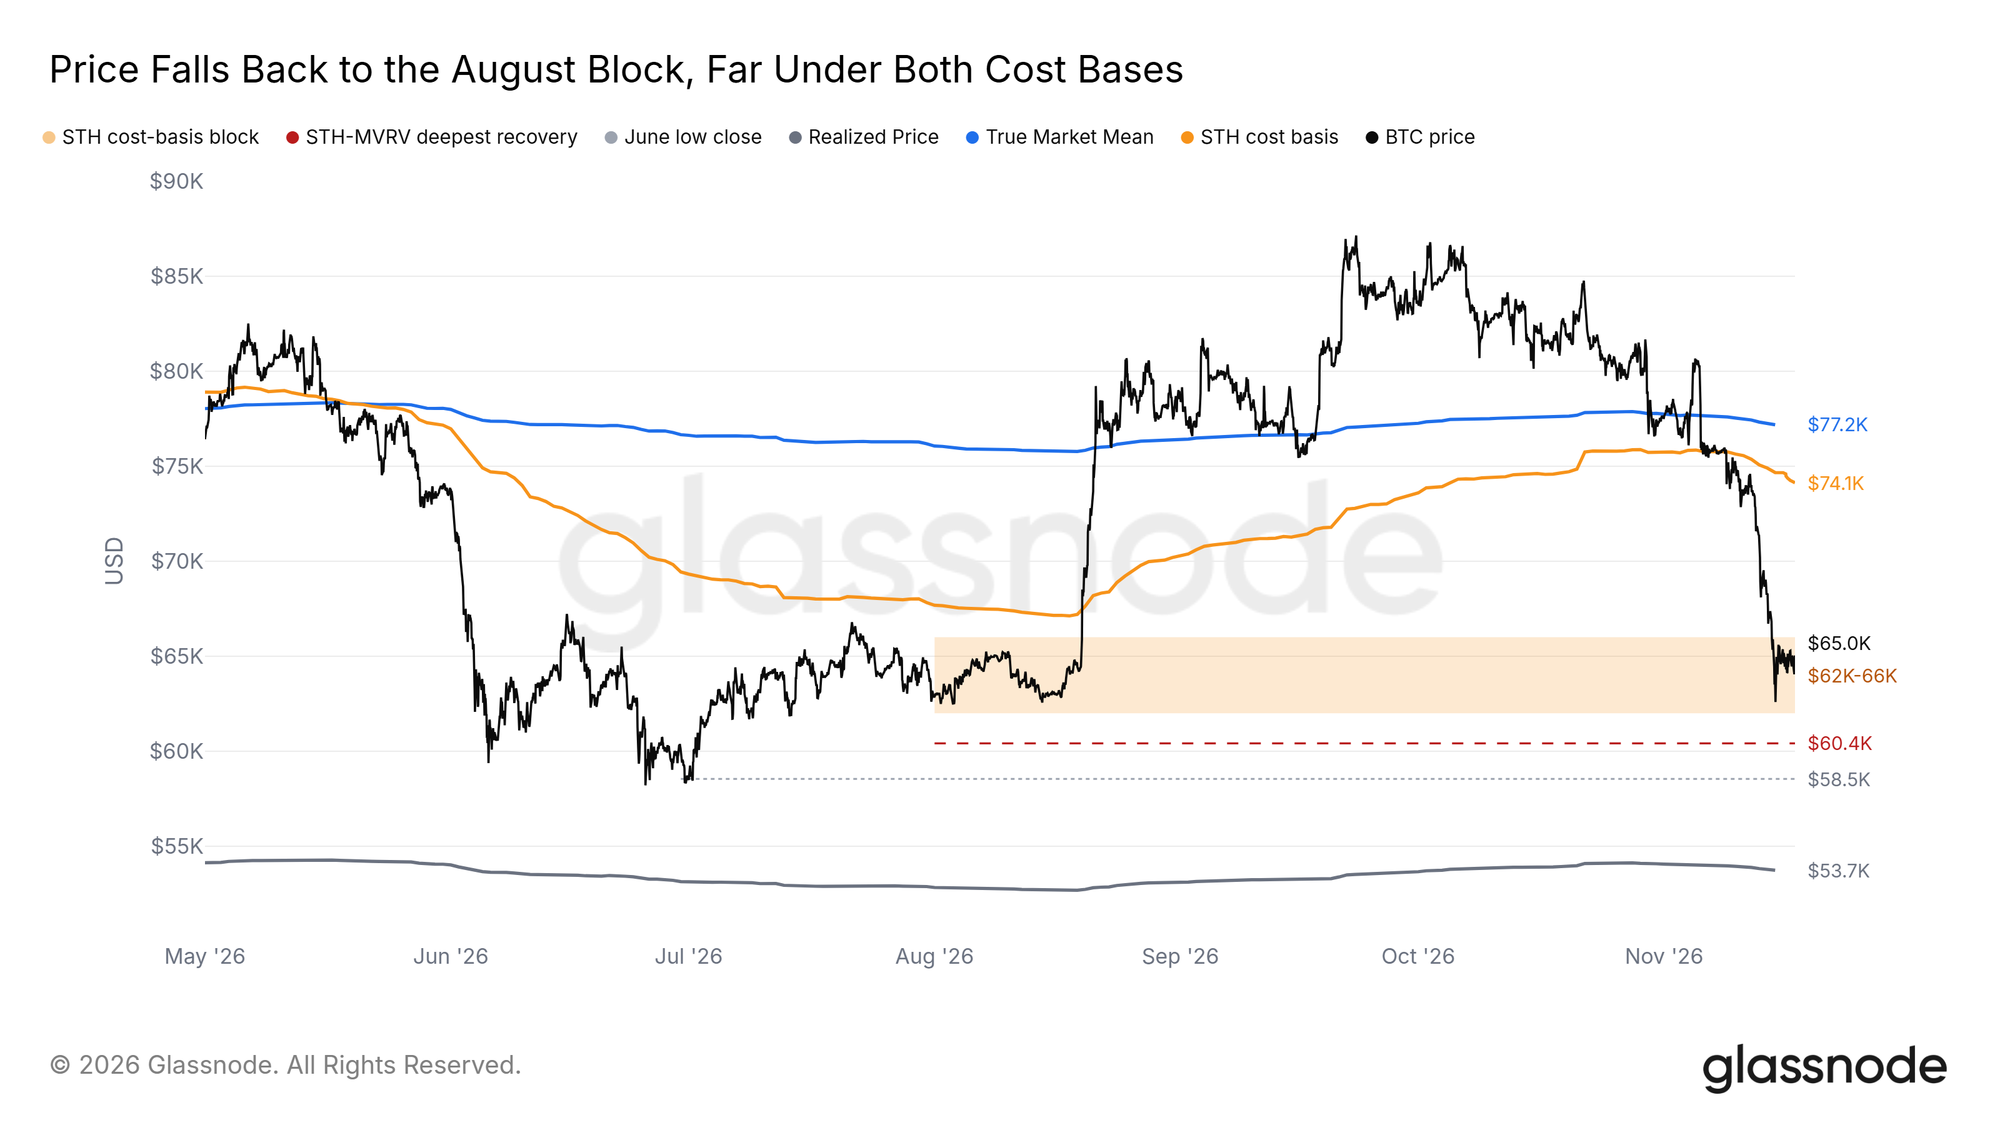
Glassnode identified $62,000–$66,000 as the only dense concentration of on-chain purchase prices immediately below spot before the fall; the November 15 low reached its lower edge. It reported few short-term-holder purchases below $62,000, with another concentration of older holdings near $48,000. The short-term-holder cost basis stood at $74,100—an average break-even reference for that group, not a price target.
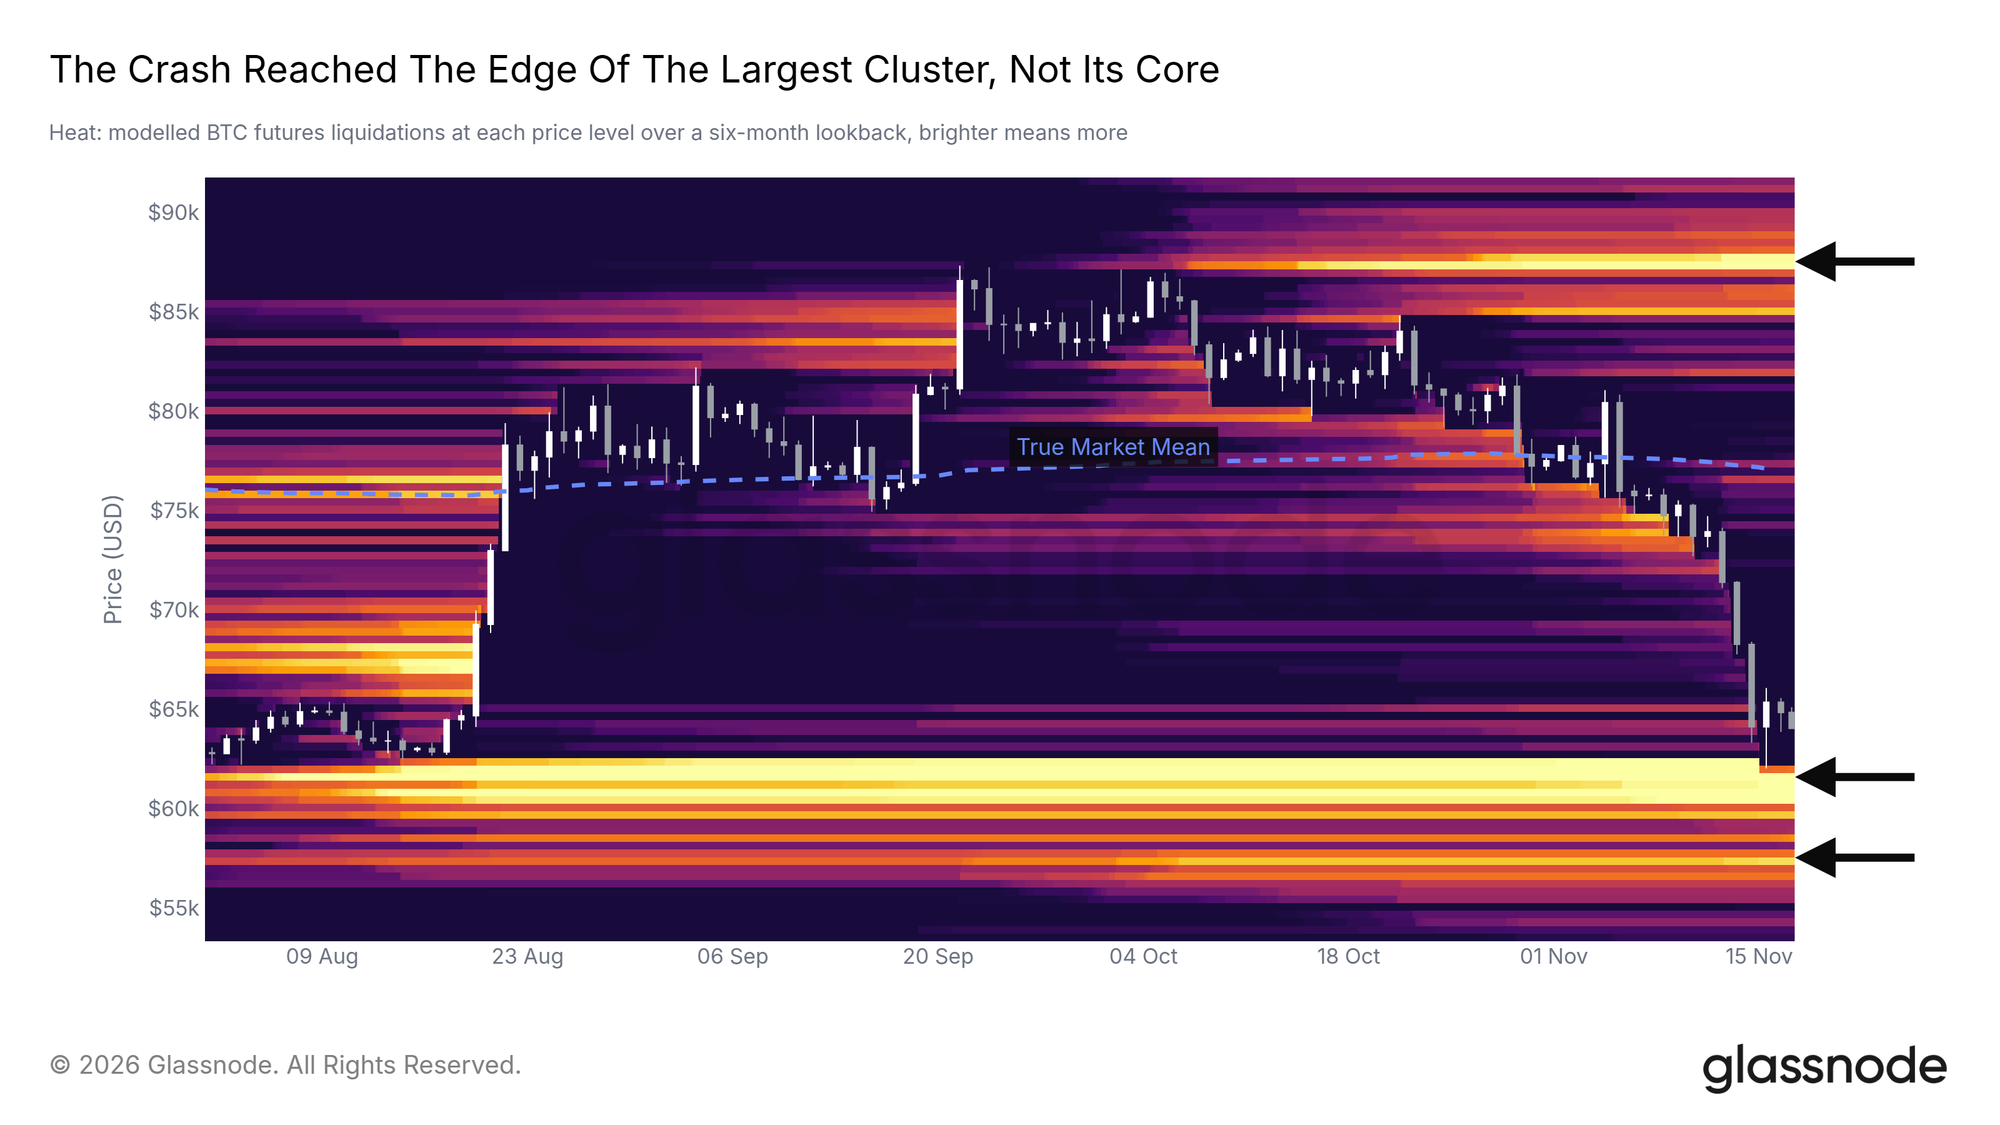
The report described substantial derivatives deleveraging. Relative to total open interest, long liquidations on November 13–14 were the largest since August 2024, according to Glassnode. Its liquidation heatmap placed a cluster at $59,500–$62,200; the November 15 intraday low entered the upper part of that range but finished above the cluster.
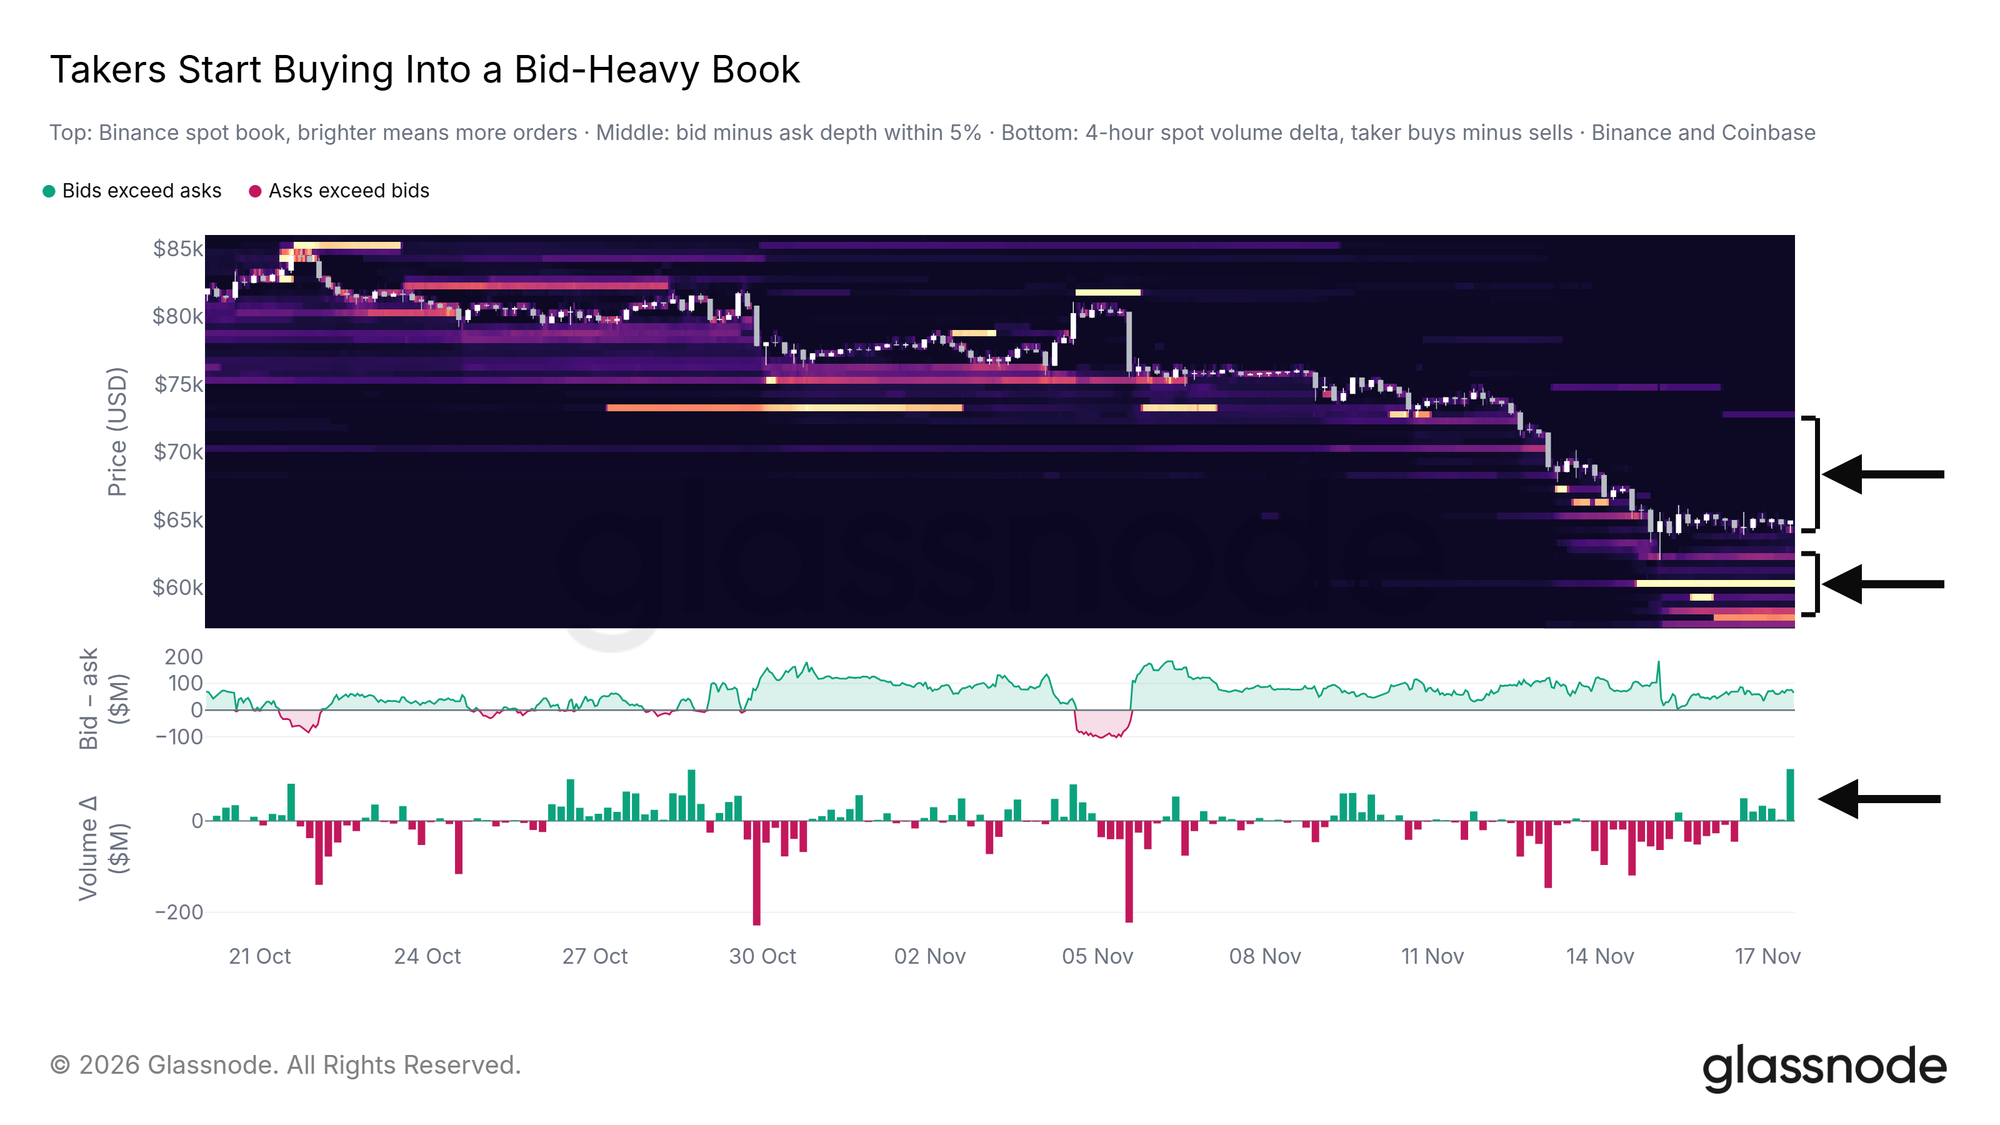
In the Binance and Coinbase order books, limit bids within 5% of spot were about 2.3 times limit asks at the time of the report. Glassnode said market-order sellers hit those bids during the fall, while taker activity had turned to net buying over the preceding day. Those are snapshots of displayed orders and executed trades, not proof that bids would remain available during another decline.
Demand beyond the order book
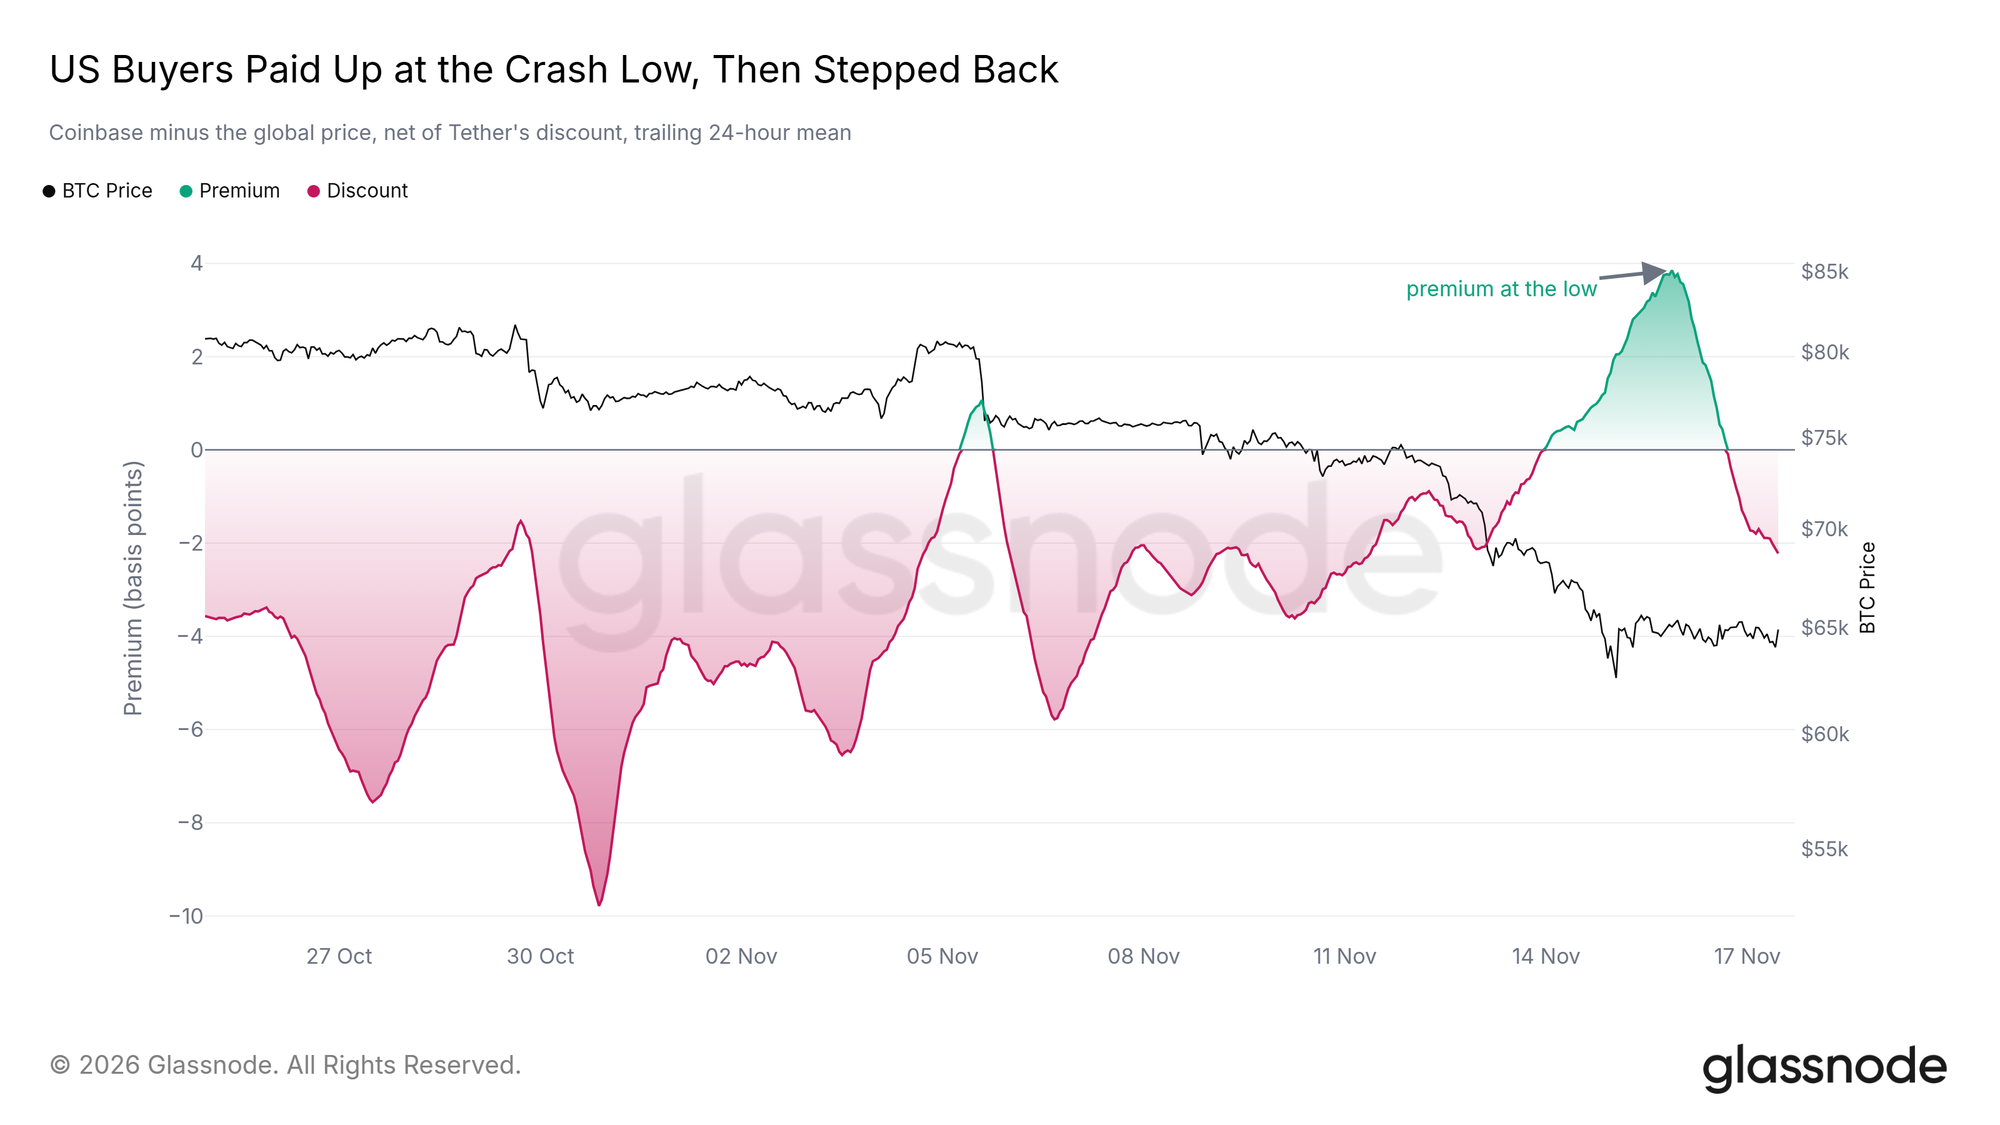
Other measures in the report gave a less supportive picture. Glassnode said the Coinbase premium—Coinbase’s price difference relative to offshore markets—had been negative for a week before briefly turning positive near the low, then returning to a small discount. It also reported a 4.2% contraction in aggregate stablecoin market capitalization over 30 days, which it characterized as the fastest outflow since late 2023.
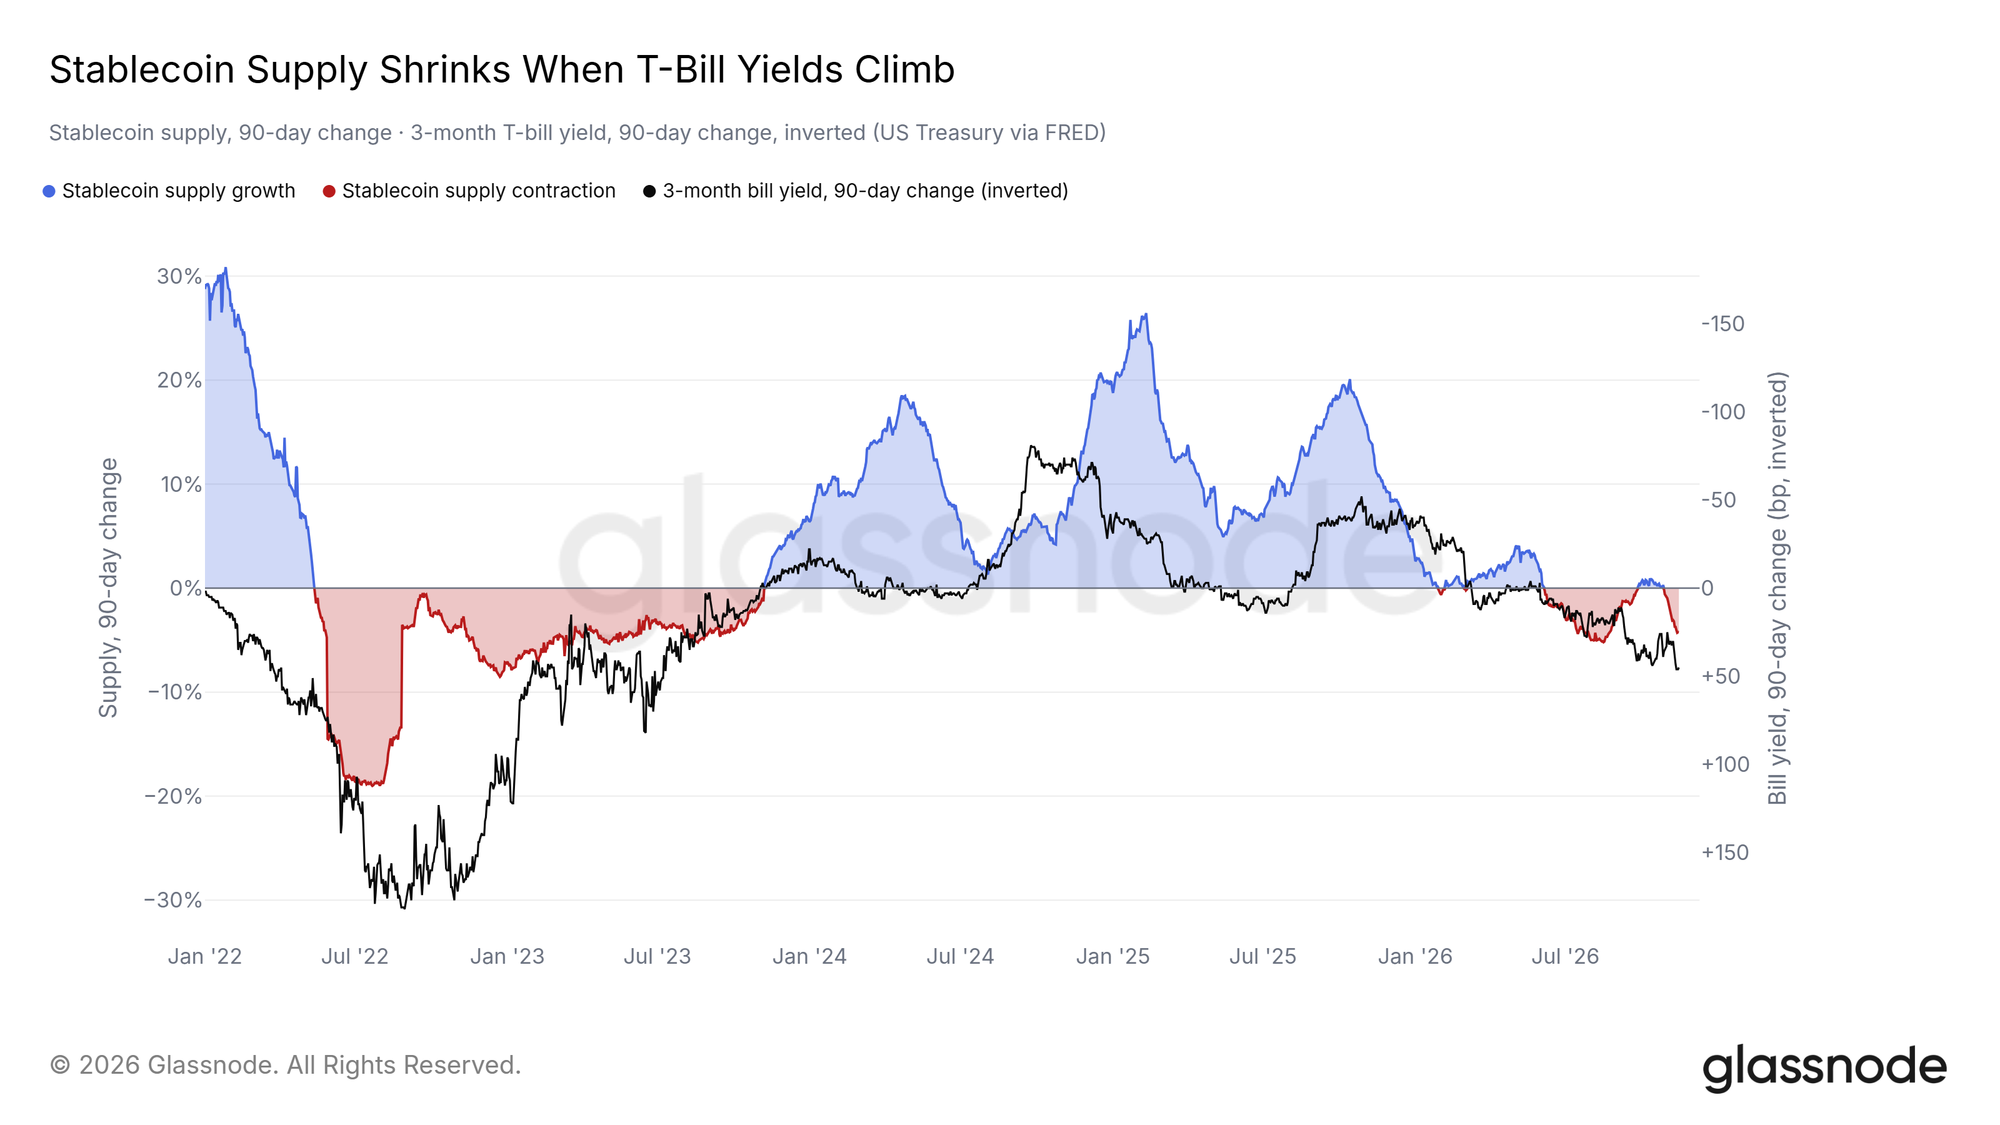
Glassnode linked stablecoin-supply weakness to periods of higher short-term US Treasury yields, noting that stablecoins do not themselves pay native yield and that three-month Treasury yields exceeded 4.3% in its reporting context. That historical relationship does not, by itself, establish why individual holders moved funds.
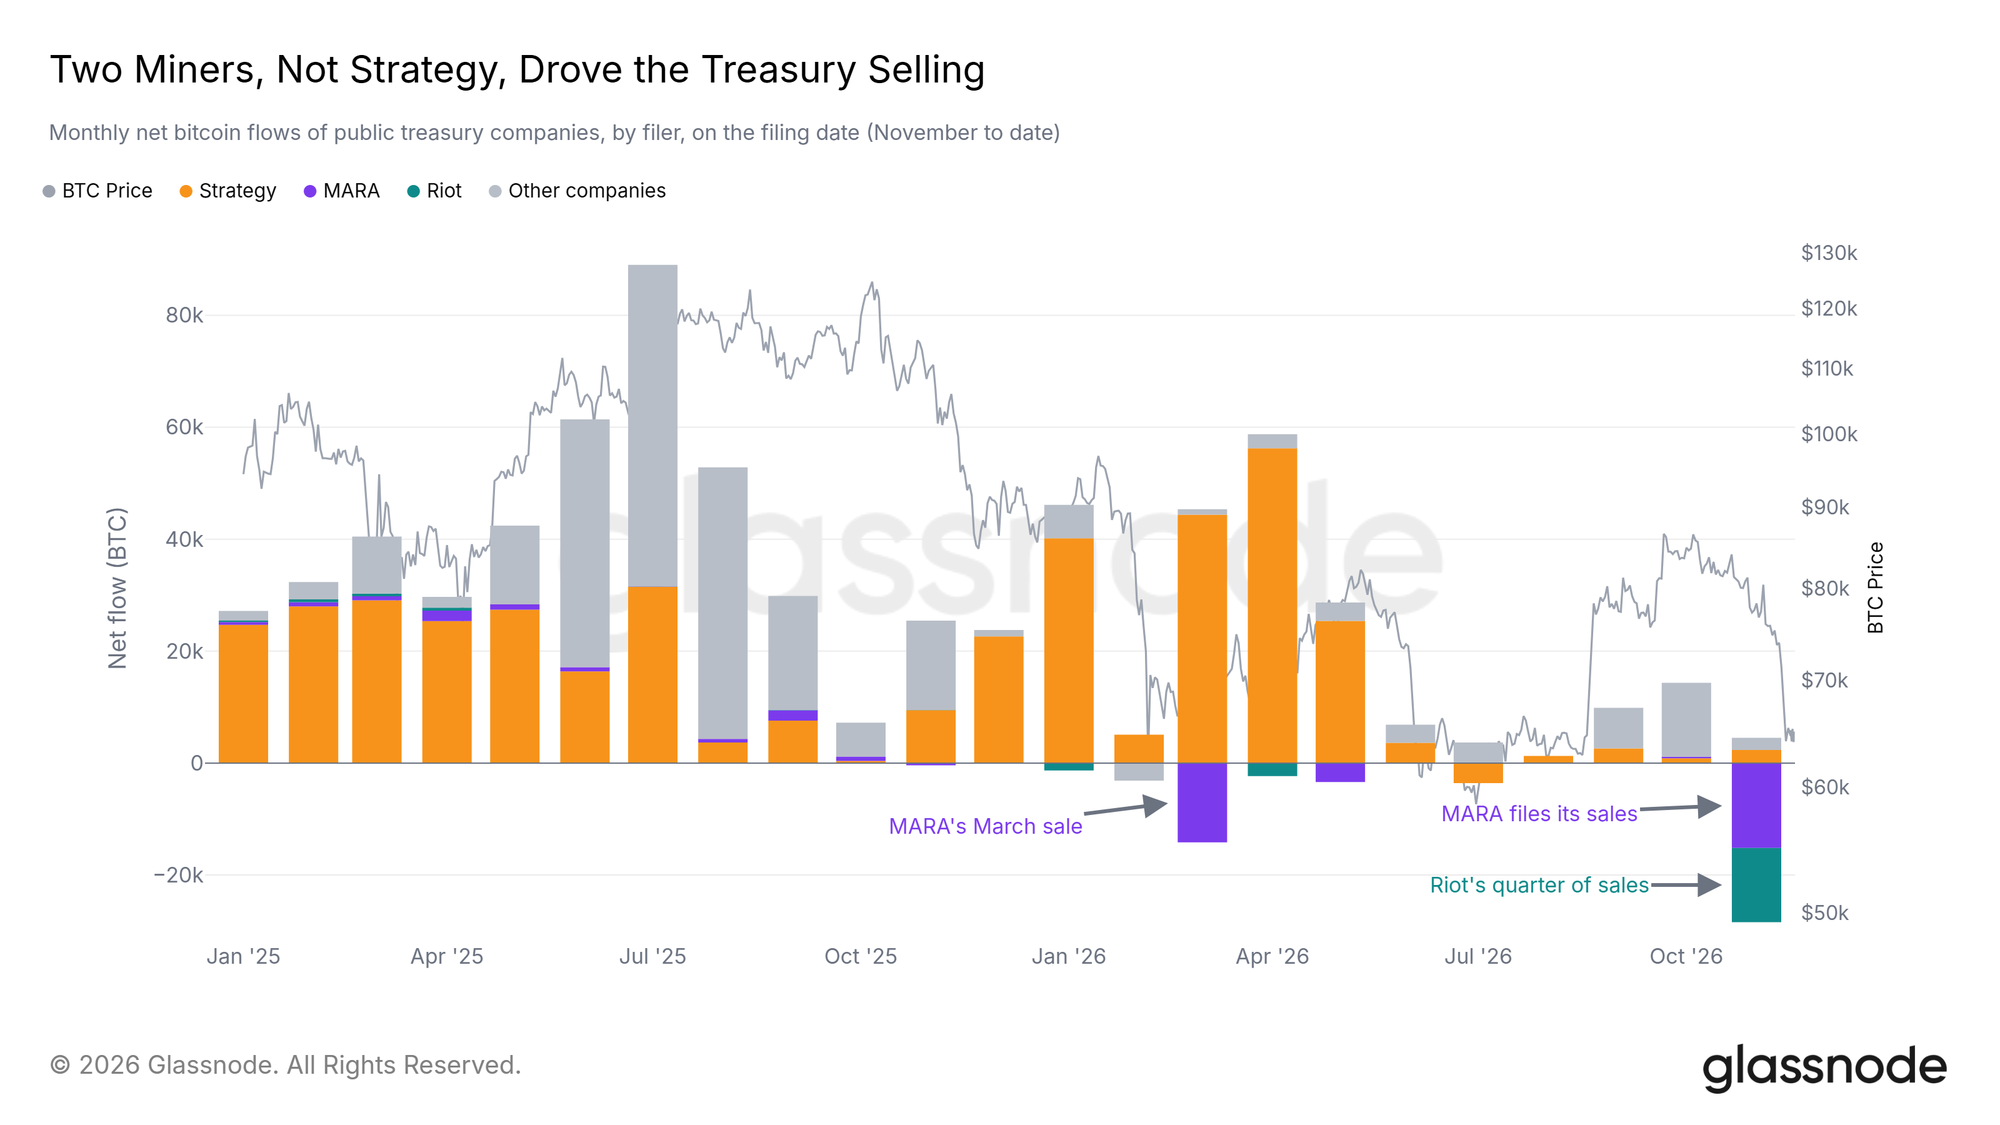
The report further said MARA and Riot had reported selling roughly 28,000 BTC in November, while MicroStrategy continued buying. It described miners’ spending on AI data-center infrastructure as a reason for Bitcoin sales. For US spot Bitcoin ETFs, it reported cumulative net outflows of $2.6 billion over the 10 trading days through November 13.
What the broader measures can—and cannot—say
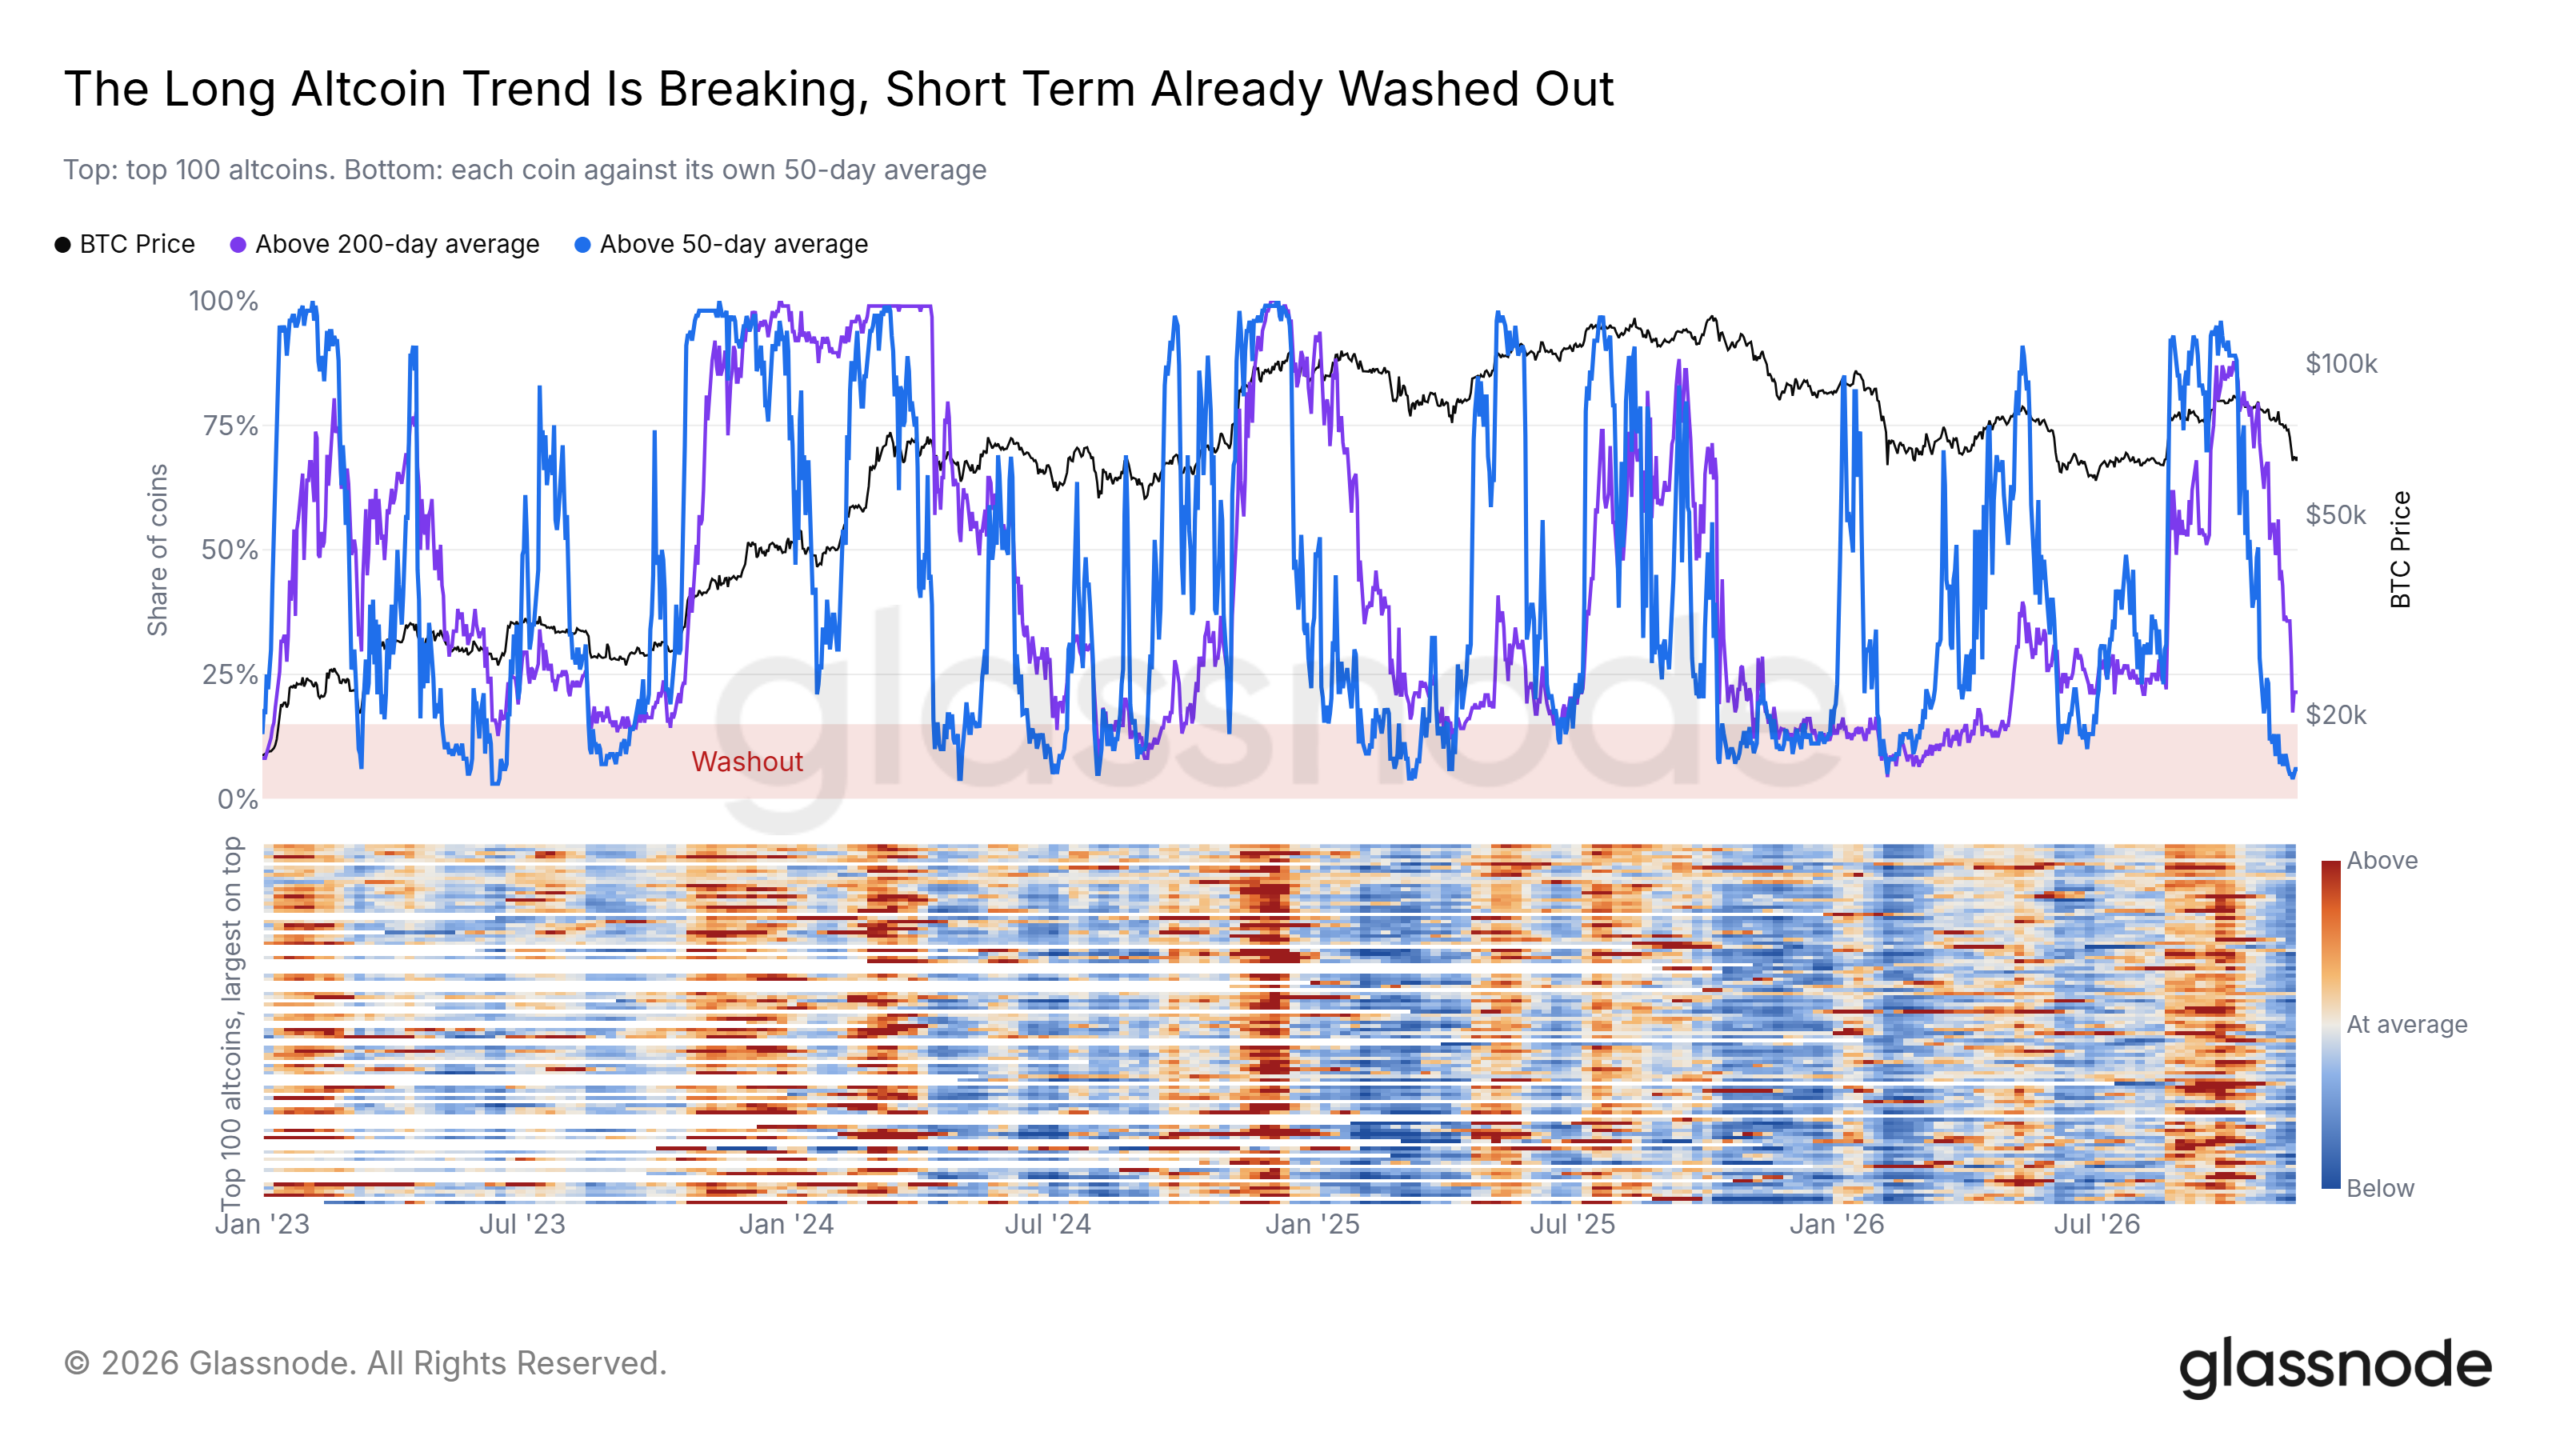
Glassnode reported that only 6% of the top 100 altcoins traded above their 50-day moving averages, while 11% traded above their 200-day moving averages—the latter matching a low recorded in July 2026. It also said that, in its historical observations since 2023, the deepest altcoin sell-offs had occurred within four days of interim Bitcoin lows, followed by higher Bitcoin prices over the next 60 days. That pattern is historical, not a reliable timing rule.
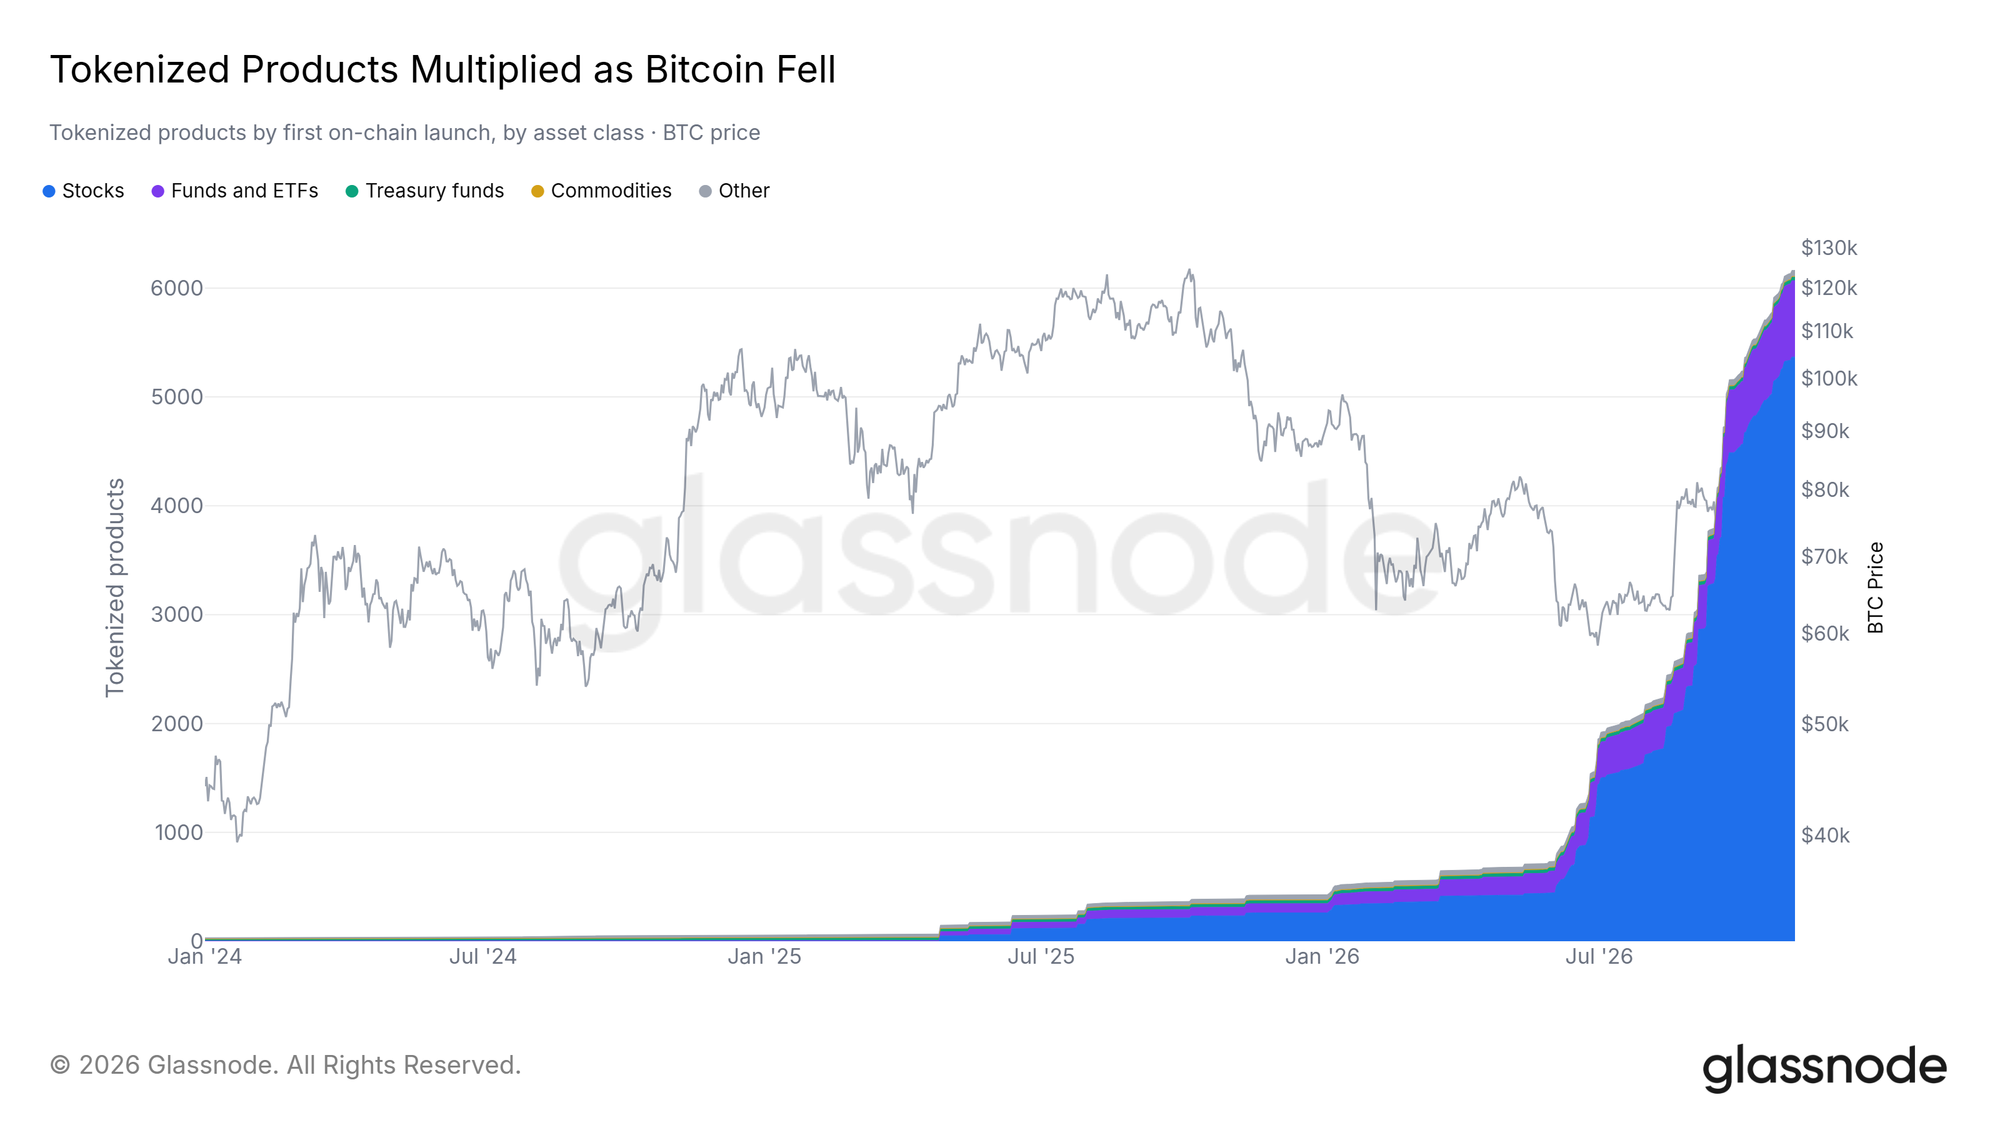
Separately, the report said the number of active on-chain tokenized financial-product projects had grown sharply during 2026. It supplied no project count in the text, so that claim cannot be quantified further here.
Taken together, Glassnode’s measures showed severe realized losses and leverage reduction alongside concentrated bids near $62,000–$66,000. Whether those bids represented durable demand remained unresolved: the same report showed weak ETF and stablecoin flows, and Bitcoin was still below the reported $74,100 short-term-holder cost basis.